## Heatmap: Accuracy Difference (Acc_test(BO - GCN)) vs. μ and λ
### Overview
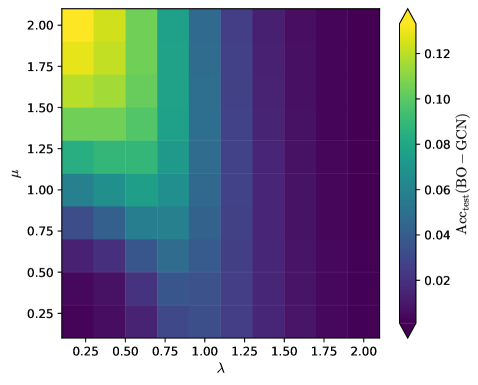
The image is a heatmap visualizing the difference in test accuracy (Acc_test) between Bayesian Optimization (BO) and Graph Convolutional Networks (GCN) across varying hyperparameters μ (y-axis) and λ (x-axis). The color gradient ranges from purple (low values) to yellow (high values), with a legend on the right indicating numerical values from 0.02 to 0.12.
### Components/Axes
- **X-axis (λ)**: Labeled "λ", with values ranging from 0.25 to 2.00 in increments of 0.25.
- **Y-axis (μ)**: Labeled "μ", with values ranging from 0.25 to 2.00 in increments of 0.25.
- **Color Scale**: Vertical legend on the right, labeled "Acc_test(BO - GCN)", with a gradient from purple (0.02) to yellow (0.12).
- **Grid**: White grid lines separate cells corresponding to discrete μ and λ values.
### Detailed Analysis
- **Top-Left Region (High μ, Low λ)**:
- Cells are yellow (≈0.12), indicating the highest accuracy differences.
- Example: At μ=2.00 and λ=0.25, the value is ≈0.12.
- **Middle Rows (Moderate μ, Moderate λ)**:
- Colors transition from green (≈0.08–0.10) to blue (≈0.04–0.06).
- Example: At μ=1.50 and λ=1.00, the value is ≈0.06.
- **Bottom-Right Region (Low μ, High λ)**:
- Cells are dark purple (≈0.02), indicating the lowest accuracy differences.
- Example: At μ=0.25 and λ=2.00, the value is ≈0.02.
- **Gradient Trends**:
- Accuracy decreases monotonically as λ increases (left to right).
- Accuracy decreases monotonically as μ decreases (top to bottom).
### Key Observations
1. **Optimal Region**: The highest accuracy differences (≈0.12) occur at high μ (2.00) and low λ (0.25).
2. **Worst Region**: The lowest accuracy differences (≈0.02) occur at low μ (0.25) and high λ (2.00).
3. **Trade-off**: Increasing λ or decreasing μ reduces accuracy, suggesting a trade-off between these parameters.
4. **Consistency**: The gradient is smooth, with no abrupt color changes, indicating a predictable relationship between μ, λ, and accuracy.
### Interpretation
The heatmap demonstrates that **higher μ and lower λ values** maximize the accuracy difference between BO and GCN. This implies that BO outperforms GCN most significantly under these parameter settings. Conversely, GCN performs relatively better (smaller accuracy gap) when μ is low and λ is high. The monotonic trends suggest that μ and λ have opposing effects on model performance, with μ likely controlling exploration/exploitation in BO and λ regulating regularization or graph structure in GCN. The absence of outliers indicates a stable, predictable relationship between these hyperparameters and accuracy.