\n
## Heatmap: Performance Comparison Before and After GRPO
### Overview
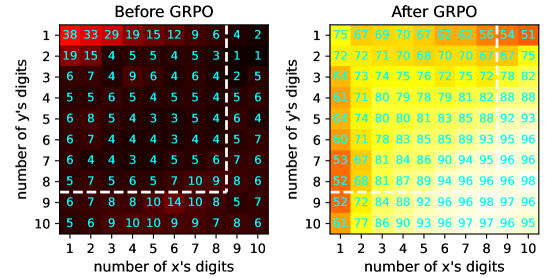
This image presents two heatmaps, visually comparing a performance metric "Before GRPO" and "After GRPO". Both heatmaps represent the relationship between the number of 'x' digits and the number of 'y' digits, with color intensity indicating the corresponding value. The x-axis represents the number of 'x' digits (ranging from 1 to 10), and the y-axis represents the number of 'y' digits (also ranging from 1 to 10).
### Components/Axes
* **Title (Left):** "Before GRPO"
* **Title (Right):** "After GRPO"
* **X-axis Label (Both):** "number of x's digits"
* **Y-axis Label (Both):** "number of y's digits"
* **X-axis Markers (Both):** 1, 2, 3, 4, 5, 6, 7, 8, 9, 10
* **Y-axis Markers (Both):** 1, 2, 3, 4, 5, 6, 7, 8, 9, 10
* **Color Scale (Left):** Ranges from dark blue (low values) to red (high values).
* **Color Scale (Right):** Ranges from dark blue (low values) to yellow (high values).
* **Legend (Implicit):** Color intensity represents the value at each (x, y) coordinate.
### Detailed Analysis or Content Details
**Before GRPO (Left Heatmap):**
The heatmap shows a generally decreasing trend as both the number of 'x' digits and the number of 'y' digits increase. The highest values are concentrated in the top-left corner.
* **(1, 1):** 38
* **(1, 2):** 19
* **(1, 3):** 29
* **(1, 4):** 15
* **(1, 5):** 12
* **(1, 6):** 9
* **(1, 7):** 6
* **(1, 8):** 4
* **(1, 9):** 2
* **(1, 10):** 4
* **(2, 1):** 15
* **(2, 2):** 4
* **(2, 3):** 5
* **(2, 4):** 5
* **(2, 5):** 4
* **(2, 6):** 3
* **(2, 7):** 1
* **(2, 8):** 1
* **(2, 9):** 1
* **(2, 10):** 1
* **(3, 1):** 6
* **(3, 2):** 7
* **(3, 3):** 4
* **(3, 4):** 9
* **(3, 5):** 6
* **(3, 6):** 4
* **(3, 7):** 2
* **(3, 8):** 5
* **(3, 9):** 6
* **(3, 10):** 6
* **(4, 1):** 5
* **(4, 2):** 5
* **(4, 3):** 6
* **(4, 4):** 5
* **(4, 5):** 5
* **(4, 6):** 4
* **(4, 7):** 5
* **(4, 8):** 6
* **(4, 9):** 6
* **(4, 10):** 6
* **(5, 1):** 6
* **(5, 2):** 8
* **(5, 3):** 5
* **(5, 4):** 3
* **(5, 5):** 3
* **(5, 6):** 5
* **(5, 7):** 4
* **(5, 8):** 6
* **(5, 9):** 4
* **(5, 10):** 4
* **(6, 1):** 6
* **(6, 2):** 7
* **(6, 3):** 4
* **(6, 4):** 4
* **(6, 5):** 3
* **(6, 6):** 4
* **(6, 7):** 5
* **(6, 8):** 7
* **(6, 9):** 6
* **(6, 10):** 6
* **(7, 1):** 6
* **(7, 2):** 4
* **(7, 3):** 4
* **(7, 4):** 3
* **(7, 5):** 5
* **(7, 6):** 5
* **(7, 7):** 6
* **(7, 8):** 7
* **(7, 9):** 6
* **(7, 10):** 6
* **(8, 1):** 5
* **(8, 2):** 7
* **(8, 3):** 5
* **(8, 4):** 6
* **(8, 5):** 7
* **(8, 6):** 10
* **(8, 7):** 9
* **(8, 8):** 8
* **(8, 9):** 6
* **(8, 10):** 6
* **(9, 1):** 6
* **(9, 2):** 7
* **(9, 3):** 8
* **(9, 4):** 8
* **(9, 5):** 10
* **(9, 6):** 14
* **(9, 7):** 10
* **(9, 8):** 8
* **(9, 9):** 5
* **(9, 10):** 7
* **(10, 1):** 5
* **(10, 2):** 6
* **(10, 3):** 9
* **(10, 4):** 10
* **(10, 5):** 9
* **(10, 6):** 7
* **(10, 7):** 8
* **(10, 8):** 6
* **(10, 9):** 6
* **(10, 10):** 6
**After GRPO (Right Heatmap):**
The heatmap shows a generally increased value across the board, with the highest values concentrated in the bottom-right corner.
* **(1, 1):** 75
* **(1, 2):** 69
* **(1, 3):** 70
* **(1, 4):** 67
* **(1, 5):** 67
* **(1, 6):** 56
* **(1, 7):** 54
* **(1, 8):** 51
* **(1, 9):** 53
* **(1, 10):** 51
* **(2, 1):** 72
* **(2, 2):** 71
* **(2, 3):** 70
* **(2, 4):** 68
* **(2, 5):** 70
* **(2, 6):** 67
* **(2, 7):** 67
* **(2, 8):** 75
* **(2, 9):** 75
* **(2, 10):** 75
* **(3, 1):** 73
* **(3, 2):** 74
* **(3, 3):** 75
* **(3, 4):** 76
* **(3, 5):** 72
* **(3, 6):** 75
* **(3, 7):** 78
* **(3, 8):** 82
* **(3, 9):** 82
* **(3, 10):** 82
* **(4, 1):** 71
* **(4, 2):** 80
* **(4, 3):** 79
* **(4, 4):** 78
* **(4, 5):** 79
* **(4, 6):** 81
* **(4, 7):** 82
* **(4, 8):** 88
* **(4, 9):** 88
* **(4, 10):** 88
* **(5, 1):** 74
* **(5, 2):** 80
* **(5, 3):** 81
* **(5, 4):** 83
* **(5, 5):** 85
* **(5, 6):** 88
* **(5, 7):** 92
* **(5, 8):** 93
* **(5, 9):** 93
* **(5, 10):** 93
* **(6, 1):** 71
* **(6, 2):** 78
* **(6, 3):** 85
* **(6, 4):** 85
* **(6, 5):** 89
* **(6, 6):** 93
* **(6, 7):** 95
* **(6, 8):** 96
* **(6, 9):** 96
* **(6, 10):** 96
* **(7, 1):** 53
* **(7, 2):** 67
* **(7, 3):** 84
* **(7, 4):** 86
* **(7, 5):** 90
* **(7, 6):** 94
* **(7, 7):** 95
* **(7, 8):** 96
* **(7, 9):** 96
* **(7, 10):** 96
* **(8, 1):** 52
* **(8, 2):** 68
* **(8, 3):** 81
* **(8, 4):** 87
* **(8, 5):** 89
* **(8, 6):** 94
* **(8, 7):** 96
* **(8, 8):** 96
* **(8, 9):** 96
* **(8, 10):** 96
* **(9, 1):** 52
* **(9, 2):** 72
* **(9, 3):** 84
* **(9, 4):** 88
* **(9, 5):** 92
* **(9, 6):** 96
* **(9, 7):** 98
* **(9, 8):** 97
* **(9, 9):** 96
* **(9, 10):** 96
* **(10, 1):** 77
* **(10, 2):** 86
* **(10, 3):** 90
* **(10, 4):** 93
* **(10, 5):** 97
* **(10, 6):** 97
* **(10, 7):** 96
* **(10, 8):** 95
* **(10, 9):** 95
* **(10, 10):** 95
### Key Observations
* The "After GRPO" heatmap consistently shows higher values than the "Before GRPO" heatmap across all combinations of 'x' and 'y' digits.
* Before GRPO, the highest values are concentrated in the upper-left corner, while after GRPO, they shift towards the bottom-right corner.
* The color scale on the right heatmap is shifted towards yellow, indicating a general increase in values.
### Interpretation
The data suggests that GRPO (presumably a process or intervention) has a positive impact on the performance metric being measured. The shift in the highest values from the top-left to the bottom-right corner indicates that the performance improvement is more pronounced when both the number of 'x' digits and the number of 'y' digits are higher. This could imply that GRPO is particularly effective in scenarios involving more complex inputs or larger datasets. The consistent increase in values across the board suggests a broad and systemic improvement due to GRPO. The heatmap provides a clear visual representation of this improvement, making it easy to identify the areas where GRPO has the greatest effect.