\n
## Diagram: Binaural MFMVDR Processing Flow
### Overview
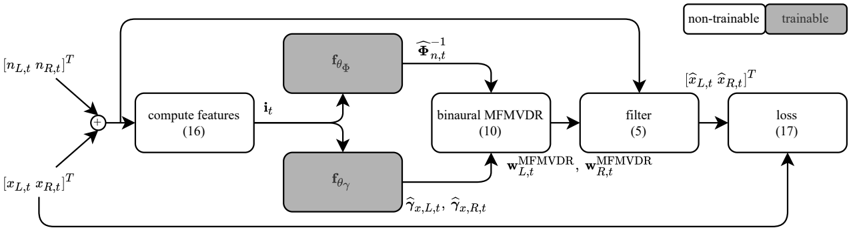
The image depicts a block diagram illustrating a binaural Multi-Frequency Multi-Channel Wiener Filter (MFMVDR) processing pipeline. The diagram shows the flow of data through several stages, including feature computation, binaural MFMVDR processing, filtering, and loss calculation. The diagram also indicates which components are trainable and non-trainable.
### Components/Axes
The diagram consists of the following components:
* **Input:** `(nL,t, rL,t)ᵀ` and `(xL,t, xR,t)ᵀ`
* **Compute Features:** (16)
* **Feature Vector:** `iₜ`
* **θθ:** Two grey boxes representing parameters, one labeled `Φₙ,ₜ⁻¹` and the other `θₜ`.
* **Binaural MFMVDR:** (10) with outputs `wL,tMFMVDR` and `wR,tMFMVDR`
* **Filter:** (5)
* **Loss:** (17)
* **Output:** `(n̂L,t, n̂R,t)ᵀ`
* **Legend:**
* White box with black text: "non-trainable"
* Black box with white text: "trainable"
### Detailed Analysis or Content Details
The diagram shows the following data flow:
1. **Input:** Two input vectors, `(nL,t, rL,t)ᵀ` and `(xL,t, xR,t)ᵀ`, are summed at a summation junction (represented by a circle with a plus sign).
2. **Compute Features:** The summed input is fed into a "compute features" block, which outputs a feature vector `iₜ`. This block contains the number (16) indicating the number of features.
3. **Binaural MFMVDR:** The feature vector `iₜ` is input to two parameter blocks `θₜ` and `Φₙ,ₜ⁻¹`. The outputs of these blocks, along with `iₜ`, are fed into a "binaural MFMVDR" block, which outputs two weight vectors: `wL,tMFMVDR` and `wR,tMFMVDR`. This block contains the number (10) indicating the number of parameters.
4. **Filter:** The weight vectors `wL,tMFMVDR` and `wR,tMFMVDR` are fed into a "filter" block, which outputs a filtered vector. This block contains the number (5) indicating the number of parameters.
5. **Loss:** The output of the filter is compared to the original input `(n̂L,t, n̂R,t)ᵀ` in a "loss" block, which calculates a loss value. This block contains the number (17) indicating the number of parameters.
6. **Feedback Loop:** The output of the "loss" block is fed back into the parameter blocks `θₜ` and `Φₙ,ₜ⁻¹`, indicating a training or optimization process.
The diagram also indicates the trainability of each block:
* The blocks `θₜ` and `Φₙ,ₜ⁻¹` are marked as "non-trainable" (white box with black text).
* The blocks "compute features", "binaural MFMVDR", "filter", and "loss" are marked as "trainable" (black box with white text).
### Key Observations
The diagram highlights a closed-loop system where the loss is used to update the trainable parameters. The separation of trainable and non-trainable components suggests a hybrid approach to parameter estimation. The numbers in parentheses likely represent the number of parameters or dimensions within each block.
### Interpretation
This diagram represents a signal processing pipeline for binaural audio, likely for tasks such as noise reduction or source separation. The MFMVDR filter is a key component, and the diagram illustrates how it is integrated into a larger trainable system. The feedback loop indicates that the system is designed to learn and adapt its parameters to minimize the loss function, improving its performance over time. The distinction between trainable and non-trainable parameters suggests that some aspects of the system are fixed, while others are learned from data. The diagram provides a high-level overview of the system architecture and data flow, without specifying the exact mathematical details of each block. The numbers in parentheses likely represent the dimensionality or number of parameters within each block, providing a sense of the complexity of each component. The diagram is a conceptual representation of the system, and the actual implementation may involve additional details and optimizations.