## Scatter Plot Comparison: PPO-RLHF vs. Proposed PPO-Collaborative Training Performance
### Overview
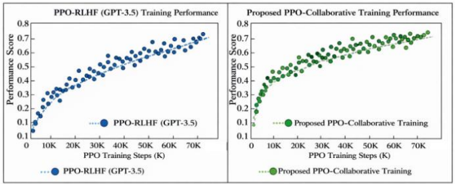
The image displays two side-by-side scatter plots comparing the training performance of two reinforcement learning methods over the same number of training steps. The left chart shows the performance of "PPO-RLHF (GPT-3.5)", and the right chart shows the performance of a "Proposed PPO-Collaborative Training" method. Both plots track a "Performance Score" against "PPO Training Steps (K)".
### Components/Axes
**Common Elements (Both Charts):**
* **Chart Type:** Scatter Plot.
* **X-Axis:** Label: "PPO Training Steps (K)". Scale: Linear, from 0 to 70K, with major tick marks at 10K intervals (0, 10K, 20K, 30K, 40K, 50K, 60K, 70K).
* **Y-Axis:** Label: "Performance Score". Scale: Linear, from 0.1 to 0.8, with major tick marks at 0.1 intervals.
* **Legend:** Positioned at the bottom center of each respective chart area.
**Left Chart Specifics:**
* **Title:** "PPO-RLHF (GPT-3.5) Training Performance" (centered above the plot).
* **Legend Label:** "PPO-RLHF (GPT-3.5)".
* **Data Point Color:** Blue.
**Right Chart Specifics:**
* **Title:** "Proposed PPO-Collaborative Training Performance" (centered above the plot).
* **Legend Label:** "Proposed PPO-Collaborative Training".
* **Data Point Color:** Green.
### Detailed Analysis
**Left Chart: PPO-RLHF (GPT-3.5)**
* **Trend Verification:** The blue data points show a clear, consistent upward trend with moderate scatter. The performance score increases steadily as training steps increase.
* **Data Point Extraction (Approximate):**
* At ~0K steps: Score ≈ 0.15
* At ~10K steps: Score ≈ 0.30
* At ~20K steps: Score ≈ 0.40
* At ~30K steps: Score ≈ 0.50
* At ~40K steps: Score ≈ 0.58
* At ~50K steps: Score ≈ 0.65
* At ~60K steps: Score ≈ 0.70
* At ~70K steps: Score ≈ 0.75
* **Distribution:** The points form a relatively tight band around an implied increasing curve. The variance (vertical spread) appears fairly consistent across the training steps.
**Right Chart: Proposed PPO-Collaborative Training**
* **Trend Verification:** The green data points also show a strong upward trend. The initial rise appears steeper than the left chart, and the final performance points reach a slightly higher maximum value. The scatter (variance) appears greater, especially in the mid-to-late training stages.
* **Data Point Extraction (Approximate):**
* At ~0K steps: Score ≈ 0.15
* At ~10K steps: Score ≈ 0.40
* At ~20K steps: Score ≈ 0.55
* At ~30K steps: Score ≈ 0.62
* At ~40K steps: Score ≈ 0.68
* At ~50K steps: Score ≈ 0.72
* At ~60K steps: Score ≈ 0.75
* At ~70K steps: Score ≈ 0.78
* **Distribution:** The points show more vertical dispersion compared to the left chart, particularly between 30K and 60K steps, suggesting higher variance in performance during those phases of training.
### Key Observations
1. **Similar Starting Point:** Both methods begin at a nearly identical performance score (~0.15) at step 0.
2. **Faster Initial Improvement:** The Proposed PPO-Collaborative method (right) shows a more rapid performance gain in the first 20K steps, reaching ~0.55 compared to ~0.40 for PPO-RLHF.
3. **Higher Final Performance:** The Proposed method achieves a higher approximate final score (~0.78) at 70K steps compared to PPO-RLHF (~0.75).
4. **Variance Difference:** The Proposed method's training exhibits greater performance variance (scatter) throughout the process, whereas the PPO-RLHF training appears more stable and consistent.
5. **Monotonic Increase:** Both data series demonstrate a monotonic increase; performance does not significantly drop at any measured interval.
### Interpretation
The data suggests that the "Proposed PPO-Collaborative Training" method offers two potential advantages over the baseline "PPO-RLHF (GPT-3.5)": **faster learning** in the early stages and a **higher ultimate performance ceiling** within the 70K step window. This could imply a more efficient or effective training algorithm.
However, the increased variance in the proposed method's scores indicates a trade-off. While it reaches higher peaks, its performance is less predictable during training, which might be a concern for stability or reproducibility. The PPO-RLHF method, while improving more slowly and peaking lower, demonstrates a more reliable and steady progression.
The comparison is designed to highlight the proposed method's superiority in key metrics (final score, early gain). A technical reader would infer that the authors are arguing for the collaborative approach's efficacy, but would also note the need to investigate the cause of the higher variance. The side-by-side presentation with identical axes allows for direct visual comparison, making the differences in trajectory and scatter immediately apparent.