## Chart: Energy Consumption of DNNs and Humans
### Overview
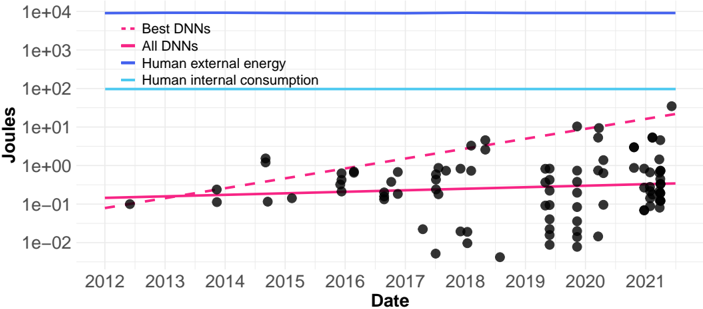
The image presents a chart comparing the energy consumption (in Joules) of Deep Neural Networks (DNNs) and humans over time (from 2012 to 2021). The chart uses a logarithmic y-axis to display a wide range of energy consumption values. It shows the energy consumption of "Best DNNs" and "All DNNs" alongside the "Human external energy" and "Human internal consumption".
### Components/Axes
* **X-axis:** Date, ranging from 2012 to 2021.
* **Y-axis:** Energy consumption in Joules, displayed on a logarithmic scale (base 10). The scale ranges from 1e-02 to 1e+04.
* **Data Series:**
* "Best DNNs" (dashed red line)
* "All DNNs" (solid magenta line)
* "Human external energy" (solid blue line)
* "Human internal consumption" (light blue line)
* **Data Points:** Black circles representing individual data points.
* **Legend:** Located at the top-center of the chart, identifying each data series by color and line style.
### Detailed Analysis
The chart shows the following trends:
* **Human external energy:** Remains relatively constant at approximately 1e+03 Joules throughout the period.
* **Human internal consumption:** Remains relatively constant at approximately 1e+02 Joules throughout the period.
* **All DNNs:** Shows a generally upward trend, starting around 1e-01 Joules in 2012 and increasing to approximately 1e+01 Joules by 2021. The line is relatively flat between 2012 and 2016, then begins to increase more rapidly.
* **Best DNNs:** Also shows an upward trend, starting around 1e-01 Joules in 2012 and increasing to approximately 1e+01 Joules by 2021. The "Best DNNs" line is consistently above the "All DNNs" line, indicating that the most efficient DNNs consume more energy than the average.
* **Data Points:** The black data points are scattered around the "All DNNs" line, showing the variability in energy consumption for different DNNs. There is a cluster of data points around 2019-2021 with higher energy consumption.
Approximate Data Points (extracted visually):
| Date | All DNNs (Joules) | Best DNNs (Joules) |
|---|---|---|
| 2012 | ~0.1 | ~0.1 |
| 2013 | ~0.1 | ~0.1 |
| 2014 | ~0.1 | ~0.2 |
| 2015 | ~0.2 | ~0.3 |
| 2016 | ~0.3 | ~0.4 |
| 2017 | ~0.2 | ~0.5 |
| 2018 | ~0.3 | ~0.6 |
| 2019 | ~1 | ~2 |
| 2020 | ~3 | ~5 |
| 2021 | ~10 | ~10 |
### Key Observations
* The energy consumption of DNNs has increased significantly over the period from 2012 to 2021.
* The energy consumption of humans (both external and internal) remains relatively stable in comparison.
* The gap between the "Best DNNs" and "All DNNs" energy consumption is widening, suggesting that improvements in DNN efficiency are not keeping pace with the overall increase in energy demand.
* There is significant variability in the energy consumption of DNNs, as indicated by the scattered data points.
### Interpretation
The chart demonstrates a clear trend of increasing energy consumption by DNNs, while human energy consumption remains relatively constant. This suggests that the growing computational demands of AI are having a significant impact on energy resources. The logarithmic scale highlights the exponential growth in DNN energy usage. The fact that the "Best DNNs" are also increasing in energy consumption, despite being the most efficient, indicates that fundamental improvements in energy efficiency are needed to mitigate the environmental impact of AI. The clustering of data points in 2019-2021 suggests a potential inflection point or a period of rapid development and deployment of more energy-intensive DNN models. The chart serves as a visual representation of the growing energy footprint of artificial intelligence and the need for sustainable AI practices.