## Chart: Two Plots Comparing Performance Metrics vs. Alpha
### Overview
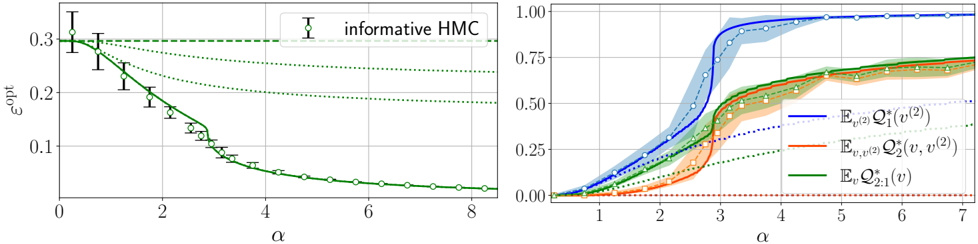
The image presents two plots side-by-side, both charting data against the variable alpha (α). The left plot shows epsilon-opt (εopt) versus alpha for "informative HMC". The right plot shows three different metrics, denoted by E[subscript v(2)]Q*[subscript 1](v(2)), E[subscript v,v(2)]Q*[subscript 2](v, v(2)), and E[subscript v]Q*[subscript 2:1](v), versus alpha.
### Components/Axes
**Left Plot:**
* **X-axis:** α (alpha), ranging from 0 to 8.
* **Y-axis:** εopt (epsilon-opt), ranging from 0 to 0.3.
* **Legend:** "informative HMC" represented by a green line with circular markers and error bars. There is also a green dashed line and a green dotted line.
**Right Plot:**
* **X-axis:** α (alpha), ranging from 1 to 7.
* **Y-axis:** Values ranging from 0.00 to 1.00.
* **Legend (located in the bottom-right):**
* E[subscript v(2)]Q*[subscript 1](v(2)) - Blue line with circular markers and shaded region.
* E[subscript v,v(2)]Q*[subscript 2](v, v(2)) - Brown/Orange line with square markers and shaded region.
* E[subscript v]Q*[subscript 2:1](v) - Green line with triangle markers and shaded region.
* There are also dotted lines of the same colors.
### Detailed Analysis
**Left Plot:**
* **Informative HMC (Green line with circular markers):** The line starts at approximately 0.3 at α=0, decreases sharply until α=4, and then plateaus around 0.05 for α > 4.
* At α=0, εopt ≈ 0.3 with error bars extending approximately +/- 0.02.
* At α=2, εopt ≈ 0.17.
* At α=4, εopt ≈ 0.07.
* At α=8, εopt ≈ 0.05.
* **Green dashed line:** The line is constant at approximately 0.3.
* **Green dotted line:** The line starts at approximately 0.3 at α=0 and decreases to approximately 0.2 at α=8.
**Right Plot:**
* **E[subscript v(2)]Q*[subscript 1](v(2)) (Blue line with circular markers):** The line starts at approximately 0 at α=1, increases sharply between α=2 and α=3, and then plateaus at approximately 0.95 for α > 3.
* At α=1, the value is approximately 0.
* At α=2, the value is approximately 0.25.
* At α=3, the value is approximately 0.9.
* At α=7, the value is approximately 0.95.
* **E[subscript v,v(2)]Q*[subscript 2](v, v(2)) (Brown/Orange line with square markers):** The line starts at approximately 0 at α=1, increases gradually between α=1 and α=4, and then plateaus at approximately 0.7 for α > 4.
* At α=1, the value is approximately 0.
* At α=2, the value is approximately 0.05.
* At α=3, the value is approximately 0.4.
* At α=7, the value is approximately 0.7.
* **E[subscript v]Q*[subscript 2:1](v) (Green line with triangle markers):** The line starts at approximately 0 at α=1, increases gradually between α=1 and α=4, and then plateaus at approximately 0.7 for α > 4.
* At α=1, the value is approximately 0.
* At α=2, the value is approximately 0.05.
* At α=3, the value is approximately 0.5.
* At α=7, the value is approximately 0.7.
* **Blue dotted line:** The line starts at approximately 0 at α=1, increases sharply between α=2 and α=3, and then plateaus at approximately 1.0 for α > 3.
* **Brown/Orange dotted line:** The line is constant at approximately 0.02.
* **Green dotted line:** The line starts at approximately 0 at α=1, increases gradually between α=1 and α=4, and then plateaus at approximately 0.15 for α > 4.
### Key Observations
* In the left plot, increasing alpha (α) generally decreases epsilon-opt (εopt) for the "informative HMC" method.
* In the right plot, all three metrics (E[subscript v(2)]Q*[subscript 1](v(2)), E[subscript v,v(2)]Q*[subscript 2](v, v(2)), and E[subscript v]Q*[subscript 2:1](v)) increase with alpha (α) until they plateau. E[subscript v(2)]Q*[subscript 1](v(2)) reaches a higher plateau than the other two.
### Interpretation
The plots suggest that increasing the parameter alpha (α) has a significant impact on both epsilon-opt (εopt) and the three metrics shown in the right plot. The left plot indicates that a higher alpha leads to a lower epsilon-opt for the "informative HMC" method, which could imply better optimization performance. The right plot shows that the metrics E[subscript v(2)]Q*[subscript 1](v(2)), E[subscript v,v(2)]Q*[subscript 2](v, v(2)), and E[subscript v]Q*[subscript 2:1](v) all improve with increasing alpha, eventually reaching a saturation point. The fact that E[subscript v(2)]Q*[subscript 1](v(2)) plateaus at a higher value than the other two suggests it may be a more effective metric under these conditions. The shaded regions around the lines in the right plot likely represent the variance or uncertainty associated with each metric. The dotted lines likely represent a different method or a baseline.