## Bar Chart: Normalized Runtime Comparison
### Overview
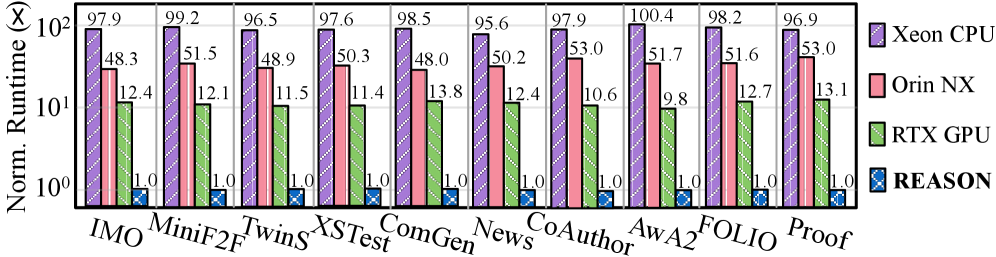
The image is a bar chart comparing the normalized runtime of different systems (Xeon CPU, Orin NX, RTX GPU, and REASON) across various workloads (IMO, MiniF2F, Twins, XSTest, ComGen, News, CoAuthor, AwA2, FOLIO, Proof). The y-axis represents the normalized runtime on a logarithmic scale, and the x-axis represents the different workloads. REASON is used as the baseline, with a normalized runtime of 1.0 for all workloads.
### Components/Axes
* **Y-axis:** "Norm. Runtime (x)" - Logarithmic scale, ranging from 10^0 to 10^2.
* **X-axis:** Workloads - IMO, MiniF2F, Twins, XSTest, ComGen, News, CoAuthor, AwA2, FOLIO, Proof.
* **Legend (Top-Right):**
* Xeon CPU (Purple with diagonal lines)
* Orin NX (Light Red/Pink)
* RTX GPU (Green with diagonal lines)
* REASON (Blue with cross-hatch pattern)
### Detailed Analysis
Here's a breakdown of the normalized runtime for each system across the different workloads:
* **REASON:** The baseline, with a normalized runtime of 1.0 for all workloads.
* **Xeon CPU (Purple):**
* IMO: 97.9
* MiniF2F: 99.2
* Twins: 96.5
* XSTest: 97.6
* ComGen: 98.5
* News: 95.6
* CoAuthor: 97.9
* AwA2: 100.4
* FOLIO: 98.2
* Proof: 96.9
* Trend: Relatively consistent runtime across all workloads, hovering around 97-100.
* **Orin NX (Pink):**
* IMO: 48.3
* MiniF2F: 51.5
* Twins: 48.9
* XSTest: 50.3
* ComGen: 48.0
* News: 50.2
* CoAuthor: 53.0
* AwA2: 51.7
* FOLIO: 51.6
* Proof: 53.0
* Trend: Relatively consistent runtime across all workloads, hovering around 48-53.
* **RTX GPU (Green):**
* IMO: 12.4
* MiniF2F: 12.1
* Twins: 11.5
* XSTest: 11.4
* ComGen: 13.8
* News: 12.4
* CoAuthor: 10.6
* AwA2: 9.8
* FOLIO: 12.7
* Proof: 13.1
* Trend: Relatively consistent runtime across all workloads, hovering around 10-14.
### Key Observations
* The Xeon CPU consistently has the highest normalized runtime across all workloads.
* The Orin NX has a significantly lower normalized runtime than the Xeon CPU, but higher than the RTX GPU.
* The RTX GPU has the lowest normalized runtime among the three systems, excluding the baseline REASON.
* REASON consistently has the lowest normalized runtime, as it is the baseline (1.0).
* The AwA2 workload shows the highest runtime for Xeon CPU (100.4).
* The AwA2 workload shows the lowest runtime for RTX GPU (9.8).
### Interpretation
The bar chart demonstrates the performance differences between the Xeon CPU, Orin NX, and RTX GPU systems relative to the REASON baseline across various workloads. The Xeon CPU consistently exhibits the highest runtime, suggesting it is the least efficient for these workloads. The Orin NX offers a moderate improvement over the Xeon CPU, while the RTX GPU provides the most significant performance improvement, achieving the lowest normalized runtime among the three systems. The consistent baseline of REASON allows for a clear comparison of the relative performance of the other systems. The data suggests that for these specific workloads, the RTX GPU is the most efficient, followed by the Orin NX, and then the Xeon CPU.