## Bar Chart: Normalized Runtime Comparison across Hardware/Software Configurations
### Overview
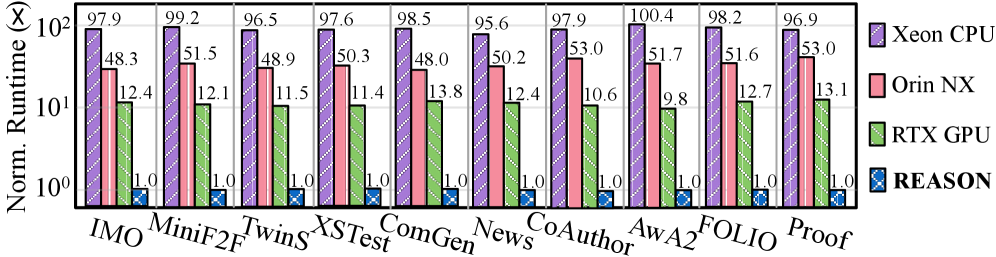
This image displays a grouped bar chart comparing the "Norm. Runtime" (Normalized Runtime) of four different systems—Xeon CPU, Orin NX, RTX GPU, and REASON—across ten distinct tasks or datasets (IMO, MiniF2F, TwinS, XSTest, ComGen, News, CoAuthor, AwA2, FOLIO, Proof). The Y-axis uses a logarithmic scale, highlighting significant performance differences between the configurations.
### Components/Axes
* **Y-Axis:** Labeled "Norm. Runtime". The scale is logarithmic, ranging from $10^0$ (1) to $10^2$ (100).
* **X-Axis:** Lists ten categories: IMO, MiniF2F, TwinS, XSTest, ComGen, News, CoAuthor, AwA2, FOLIO, Proof.
* **Legend (Right side):**
* **Purple (hatched):** Xeon CPU
* **Pink (solid):** Orin NX
* **Green (hatched):** RTX GPU
* **Blue (hatched):** REASON
### Detailed Analysis
The chart presents a consistent hierarchy of performance across all ten categories. REASON is consistently the fastest (normalized to 1.0), followed by the RTX GPU, then the Orin NX, with the Xeon CPU consistently showing the highest runtime.
Below is the data extracted for each category:
| Category | Xeon CPU (Purple) | Orin NX (Pink) | RTX GPU (Green) | REASON (Blue) |
| :--- | :--- | :--- | :--- | :--- |
| **IMO** | 97.9 | 48.3 | 12.4 | 1.0 |
| **MiniF2F** | 99.2 | 51.5 | 12.1 | 1.0 |
| **TwinS** | 96.5 | 48.9 | 11.5 | 1.0 |
| **XSTest** | 97.6 | 50.3 | 11.4 | 1.0 |
| **ComGen** | 98.5 | 48.0 | 13.8 | 1.0 |
| **News** | 95.6 | 50.2 | 12.4 | 1.0 |
| **CoAuthor** | 97.9 | 53.0 | 10.6 | 1.0 |
| **AwA2** | 100.4 | 51.7 | 9.8 | 1.0 |
| **FOLIO** | 98.2 | 51.6 | 12.7 | 1.0 |
| **Proof** | 96.9 | 53.0 | 13.1 | 1.0 |
### Key Observations
* **Performance Hierarchy:** The performance order is invariant across all tasks: REASON (fastest) > RTX GPU > Orin NX > Xeon CPU (slowest).
* **Magnitude of Difference:** Because the Y-axis is logarithmic, the visual gaps represent orders of magnitude. REASON is approximately 10x faster than the RTX GPU, ~50x faster than the Orin NX, and ~100x faster than the Xeon CPU.
* **Consistency:** The runtime values for each hardware configuration remain relatively stable across all tasks, suggesting that the performance characteristics of these systems are not highly dependent on the specific dataset/task type provided.
* **Outliers:**
* **AwA2** shows the highest runtime for the Xeon CPU (100.4) and the lowest runtime for the RTX GPU (9.8).
* **CoAuthor** and **Proof** share the highest runtime for the Orin NX (53.0).
### Interpretation
The data demonstrates that "REASON" is a highly optimized inference engine or framework, providing a massive performance advantage (normalized to 1.0) compared to standard hardware execution environments.
The use of a logarithmic scale is critical here; without it, the REASON bars (at 1.0) would be invisible compared to the Xeon CPU bars (near 100). This visualization is likely intended to showcase the efficiency gains of the REASON system. The fact that the relative performance remains consistent across diverse tasks (ranging from mathematical proofs like IMO/MiniF2F to text generation like CoAuthor/News) suggests that REASON provides a generalized speedup rather than one specific to a single type of workload.