# Technical Data Extraction: Principal Component Analysis (PCA) of Experts
This document contains a technical extraction of data from a three-panel scatter plot visualization representing the distribution of "Experts" in a 2D principal component space (PC1 vs PC2).
## 1. General Chart Metadata
* **Type:** Scatter Plot (3-panel comparison)
* **X-Axis Label:** PC1 (Principal Component 1)
* **Y-Axis Label:** PC2 (Principal Component 2)
* **Axis Scales:**
* **PC1 Range:** Approximately -1.0 to 4.0 (Markers at 0, 2, 4)
* **PC2 Range:** Approximately -2.5 to 1.5 (Markers at -2, -1, 0, 1)
* **Grid:** Light gray orthogonal grid lines.
## 2. Legend and Categories
The visualization uses color and marker styles to differentiate three states of data points:
| Category | Color | Marker Style | Description |
| :--- | :--- | :--- | :--- |
| **Original Experts** | Light Red / Pink | Open Circle | The baseline distribution of all expert entities. |
| **Surviving** | Blue | Solid Circle | A subset of the original experts that remained after a process. |
| **Merged** | Green | "x" Cross | New entities formed by merging original experts. |
---
## 3. Panel Analysis
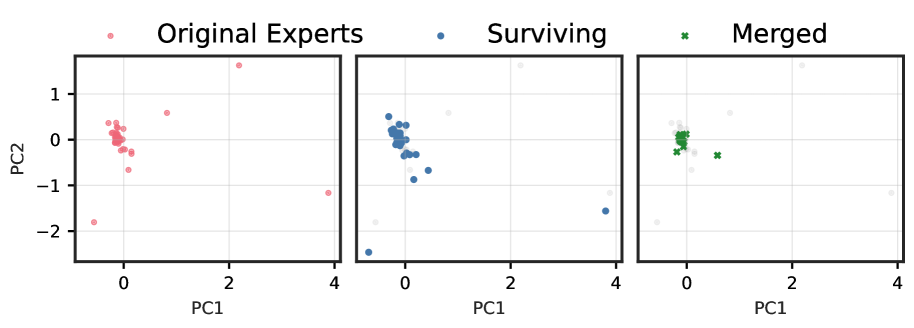
### Panel 1: Original Experts (Left)
* **Data Distribution:** The majority of points are tightly clustered around the origin (PC1 ≈ 0, PC2 ≈ 0).
* **Outliers:**
* One point at approximately (PC1: 3.8, PC2: -1.2).
* One point at approximately (PC1: 2.2, PC2: 1.6).
* One point at approximately (PC1: 0.8, PC2: 0.6).
* One point at approximately (PC1: -0.6, PC2: -1.8).
* **Cluster Density:** High density in the range PC1 [-0.5, 0.2] and PC2 [-0.5, 0.5].
### Panel 2: Surviving (Center)
* **Visual Context:** The "Original Experts" are shown as faint, light-gray background points. The "Surviving" experts are highlighted in blue.
* **Key Observations:**
* The surviving experts represent the bulk of the central cluster.
* The extreme outlier at (PC1: -0.8, PC2: -2.5) is a surviving expert.
* The outlier at (PC1: 3.8, PC2: -1.5) is a surviving expert.
* The outliers at (PC1: 2.2, PC2: 1.6) and (PC1: 0.8, PC2: 0.6) are **not** highlighted, indicating they did not "survive" in their original form.
### Panel 3: Merged (Right)
* **Visual Context:** Original points are shown in light gray. The "Merged" entities are highlighted with green "x" markers.
* **Key Observations:**
* The merged entities are concentrated almost exclusively in the central cluster (PC1 ≈ 0, PC2 ≈ 0).
* There is one merged entity located at approximately (PC1: 0.6, PC2: -0.3), which appears to be a result of merging points that were previously outliers or on the edge of the main cluster.
* None of the extreme outliers (far right or far bottom-left) are part of the "Merged" group.
---
## 4. Summary of Trends
1. **Centrality:** The vast majority of experts (Original, Surviving, and Merged) occupy a dense region near the intersection of PC1=0 and PC2=0.
2. **Survival of Outliers:** Some extreme outliers survive the process independently (notably the points at the far right and bottom-left).
3. **Merging Behavior:** Merging primarily occurs among experts that were already spatially similar in the PC space (the central cluster), with the exception of one slightly displaced merged point on the positive PC1 axis.