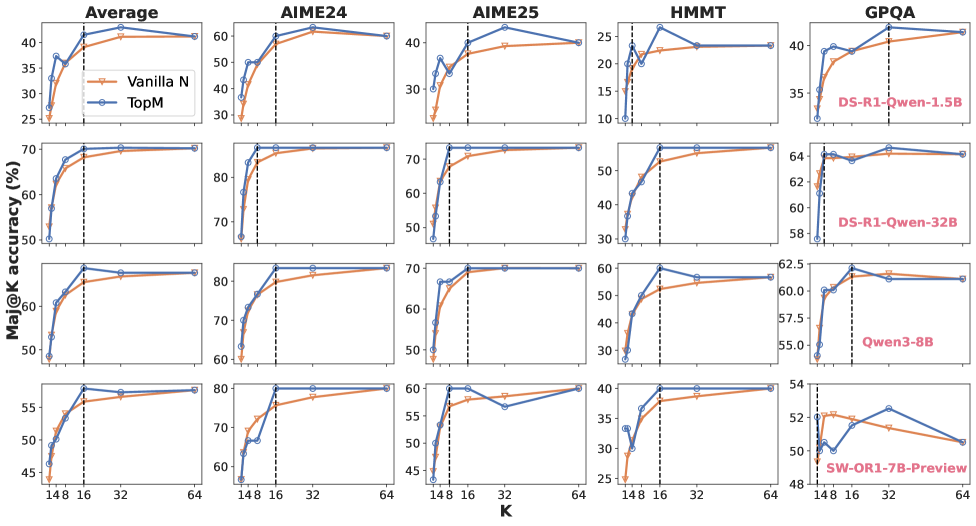
## Line Chart Grid: Model Performance vs. K Value
### Overview
The image presents a grid of line charts comparing the performance of two models, "Vanilla N" and "TopM," across different tasks and model sizes. The x-axis represents the value of 'K', and the y-axis represents the "Maj@K accuracy (%)". Each chart shows how the accuracy changes as 'K' varies for a specific task and model configuration.
### Components/Axes
* **X-axis:** 'K' (values: 1, 4, 8, 16, 32, 64). Logarithmic scale.
* **Y-axis:** Maj@K accuracy (%). The scale varies between charts, but generally spans a range of 20-30 percentage points.
* **Legend:** Located in the top-left chart ("Average").
* Vanilla N (orange line with downward-pointing triangle markers)
* TopM (blue line with circle markers)
* **Chart Titles (Top Row):** Average, AIME24, AIME25, HMMT, GPQA
* **Model Size Labels (Right Column):** (These are in pink text)
* DS-R1-Qwen-1.5B
* DS-R1-Qwen-32B
* Qwen3-8B
* SW-OR1-7B-Preview
* **Vertical Dashed Line:** Appears in each chart at K=8.
### Detailed Analysis
The grid is organized as follows:
* **Rows:** Each row corresponds to a different model size (as indicated by the labels in the right column).
* **Columns:** Each column corresponds to a different task or evaluation metric (as indicated by the titles in the top row).
**Individual Chart Analysis (Examples):**
* **Average, DS-R1-Qwen-1.5B (Top-Left):**
* Vanilla N (orange): Starts at approximately 25% accuracy at K=1, rises sharply to approximately 40% at K=8, then plateaus around 41% for K=16 to K=64.
* TopM (blue): Starts at approximately 25% accuracy at K=1, rises sharply to approximately 37% at K=4, then rises more gradually to approximately 42% at K=16, and plateaus around 42% for K=32 to K=64.
* **AIME24, DS-R1-Qwen-1.5B:**
* Vanilla N (orange): Starts at approximately 30% accuracy at K=1, rises sharply to approximately 60% at K=8, then plateaus around 60% for K=16 to K=64.
* TopM (blue): Starts at approximately 30% accuracy at K=1, rises sharply to approximately 60% at K=8, then plateaus around 60% for K=16 to K=64.
* **GPQA, SW-OR1-7B-Preview (Bottom-Right):**
* Vanilla N (orange): Starts at approximately 45% accuracy at K=1, rises sharply to approximately 52% at K=4, then decreases slightly to approximately 51% at K=8, and plateaus around 51% for K=16 to K=64.
* TopM (blue): Starts at approximately 50% accuracy at K=1, rises sharply to approximately 53% at K=4, then decreases slightly to approximately 52% at K=8, and plateaus around 52% for K=16 to K=64.
**General Trends:**
* Both models generally show a rapid increase in accuracy as 'K' increases from 1 to 8.
* Beyond K=8, the accuracy tends to plateau or increase only slightly.
* The TopM model often outperforms the Vanilla N model, especially at lower values of K.
* The specific accuracy values and the magnitude of the improvement vary significantly depending on the task and model size.
### Key Observations
* **Diminishing Returns:** Increasing 'K' beyond 8 provides diminishing returns in terms of accuracy improvement.
* **Model Preference:** TopM generally performs better than Vanilla N, especially at lower K values.
* **Task Dependence:** The absolute accuracy values and the relative performance of the models are highly dependent on the specific task (Average, AIME24, AIME25, HMMT, GPQA).
* **Model Size Dependence:** The model size (DS-R1-Qwen-1.5B, DS-R1-Qwen-32B, Qwen3-8B, SW-OR1-7B-Preview) also influences the accuracy, but the relationship is not immediately clear from these charts alone.
### Interpretation
The charts suggest that using a higher value of 'K' can improve the accuracy of both Vanilla N and TopM models, but the benefits are most pronounced at lower values of 'K'. The TopM model appears to be generally more effective than Vanilla N. The optimal value of 'K' and the choice of model may depend on the specific task and the available computational resources. The vertical dashed line at K=8 highlights a point of diminishing returns, suggesting that this value might be a reasonable trade-off between accuracy and computational cost. Further analysis would be needed to determine the precise relationship between model size and performance.