\n
## Scatter Plot: Human Sexuality Confidence vs. Target Length
### Overview
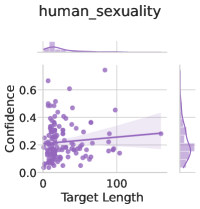
The image presents a scatter plot visualizing the relationship between "Target Length" and "Confidence" for the category "human_sexuality". A regression line with a confidence interval is overlaid on the scatter points. Marginal histograms are displayed above and to the right of the main plot, showing the distributions of "Target Length" and "Confidence" respectively.
### Components/Axes
* **Title:** "human\_sexuality" (top-center)
* **X-axis:** "Target Length" (bottom-center), ranging from approximately 0 to 120.
* **Y-axis:** "Confidence" (left-center), ranging from 0.0 to 0.6.
* **Scatter Points:** Purple dots representing individual data points.
* **Regression Line:** A purple line representing the trend of the data. It has a slight negative slope.
* **Confidence Interval:** A shaded purple area around the regression line, indicating the uncertainty in the estimated trend.
* **Marginal Histogram (Top):** Displays the distribution of "Target Length".
* **Marginal Histogram (Right):** Displays the distribution of "Confidence".
### Detailed Analysis
The scatter plot shows a weak, slightly negative correlation between "Target Length" and "Confidence".
* **Scatter Point Distribution:** The majority of points cluster in the lower-left quadrant, with "Target Length" values between 0 and 50 and "Confidence" values between 0.0 and 0.3. There is a sparse scattering of points extending towards higher "Target Length" values (up to approximately 120) and "Confidence" values (up to approximately 0.6).
* **Regression Line Trend:** The regression line slopes downward slightly, indicating that as "Target Length" increases, "Confidence" tends to decrease, but the effect is very weak.
* **Regression Line Equation (Approximate):** Visually, the line appears to intersect the Y-axis around 0.25 and has a slope of approximately -0.002.
* **Confidence Interval:** The confidence interval is relatively wide, indicating a high degree of uncertainty in the estimated relationship.
* **Marginal Histogram - Target Length:** The distribution of "Target Length" is skewed to the right, with a peak around 0-10 and a tail extending to higher values.
* **Marginal Histogram - Confidence:** The distribution of "Confidence" is skewed to the right, with a peak around 0.1-0.2 and a tail extending to higher values.
### Key Observations
* The relationship between "Target Length" and "Confidence" is weak and potentially non-linear.
* There is a significant amount of variability in "Confidence" for a given "Target Length".
* The marginal histograms suggest that both "Target Length" and "Confidence" are positively skewed.
* The confidence interval is wide, indicating low statistical power or a genuinely noisy relationship.
### Interpretation
The data suggests that "Target Length" is not a strong predictor of "Confidence" for the category "human\_sexuality". The slight negative trend could indicate that longer targets are associated with slightly lower confidence, but this effect is small and may not be statistically significant. The wide confidence interval suggests that other factors likely play a more important role in determining "Confidence". The skewed distributions of both variables suggest that the data may not be normally distributed, which could affect the validity of the regression analysis. The marginal histograms provide insight into the distribution of each variable independently, showing that both are concentrated at lower values. The overall plot suggests a complex relationship that is not easily captured by a simple linear model.