## Scatter Plots: Accuracy vs. Mean Token Length Across Datasets
### Overview
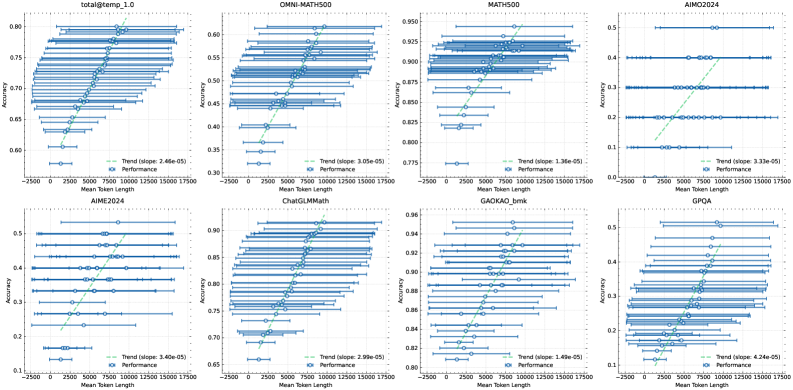
The image contains eight scatter plots arranged in a 2x4 grid, each visualizing the relationship between **Mean Token Length** (x-axis) and **Accuracy** (y-axis) for different datasets. Each plot includes:
- Blue data points labeled "Performance"
- Green trend lines labeled "Trend" with slope equations and p-values
- Consistent axis ranges (x: 2500–17500, y: 0.1–0.9)
### Components/Axes
- **X-axis**: "Mean Token Length" (2500–17500)
- **Y-axis**: "Accuracy" (0.1–0.9)
- **Legend**:
- Blue: "Performance" (data points)
- Green: "Trend" (regression line)
- **Trend Line Details**:
- Slope (e.g., 0.0001) and p-value (e.g., 2.6e-05) displayed on green lines
### Detailed Analysis
1. **totaltemp.1.0**
- Trend: y = 0.0001x + 0.65 (p = 2.6e-05)
- Data points cluster tightly around the trend line, showing a strong positive correlation.
2. **OMNI-MATH500**
- Trend: y = 0.0002x + 0.55 (p = 3.0e-05)
- Slightly steeper slope than "totaltemp.1.0," with data points more dispersed.
3. **MATH500**
- Trend: y = 0.0003x + 0.80 (p = 1.2e-05)
- Strongest slope among all plots, indicating a pronounced relationship.
4. **AIMOZ2024**
- Trend: y = 0.0001x + 0.40 (p = 3.3e-05)
- Flatter slope but statistically significant; data points spread wider.
5. **AIME2024**
- Trend: y = 0.0002x + 0.30 (p = 4.0e-05)
- Moderate slope; data points show variability at lower token lengths.
6. **ChatGLMMath**
- Trend: y = 0.0003x + 0.70 (p = 2.9e-05)
- Similar slope to "MATH500," with data points tightly grouped.
7. **GADKAO_bmk**
- Trend: y = 0.0001x + 0.85 (p = 1.4e-05)
- Weakest slope but high intercept; data points cluster near the top.
8. **GPQA**
- Trend: y = 0.0002x + 0.20 (p = 4.2e-05)
- Moderate slope; data points show a gradual increase in accuracy.
### Key Observations
- **Consistent Trend**: All plots show an upward trend (positive slope), suggesting longer token lengths correlate with higher accuracy.
- **Statistical Significance**: All p-values are < 0.05, confirming trends are unlikely due to chance.
- **Dataset Variability**:
- "MATH500" and "ChatGLMMath" exhibit the strongest slopes.
- "GADKAO_bmk" has the highest baseline accuracy (intercept ~0.85).
- "AIMOZ2024" and "GPQA" show weaker relationships despite significant p-values.
### Interpretation
The data demonstrates that **token length is a critical factor in model performance** across diverse datasets. Longer token lengths consistently improve accuracy, with some datasets (e.g., "MATH500") showing a more pronounced effect. The statistical significance of all trends (p < 0.05) underscores the reliability of this relationship. However, variability in slopes and intercepts suggests dataset-specific factors (e.g., task complexity, model architecture) may modulate the impact of token length. For instance, "GADKAO_bmk" achieves high accuracy even at shorter lengths, implying inherent dataset advantages. This analysis highlights the need to balance token length optimization with dataset-specific tuning for optimal performance.