## Line Chart: Pass@k Performance Comparison
### Overview
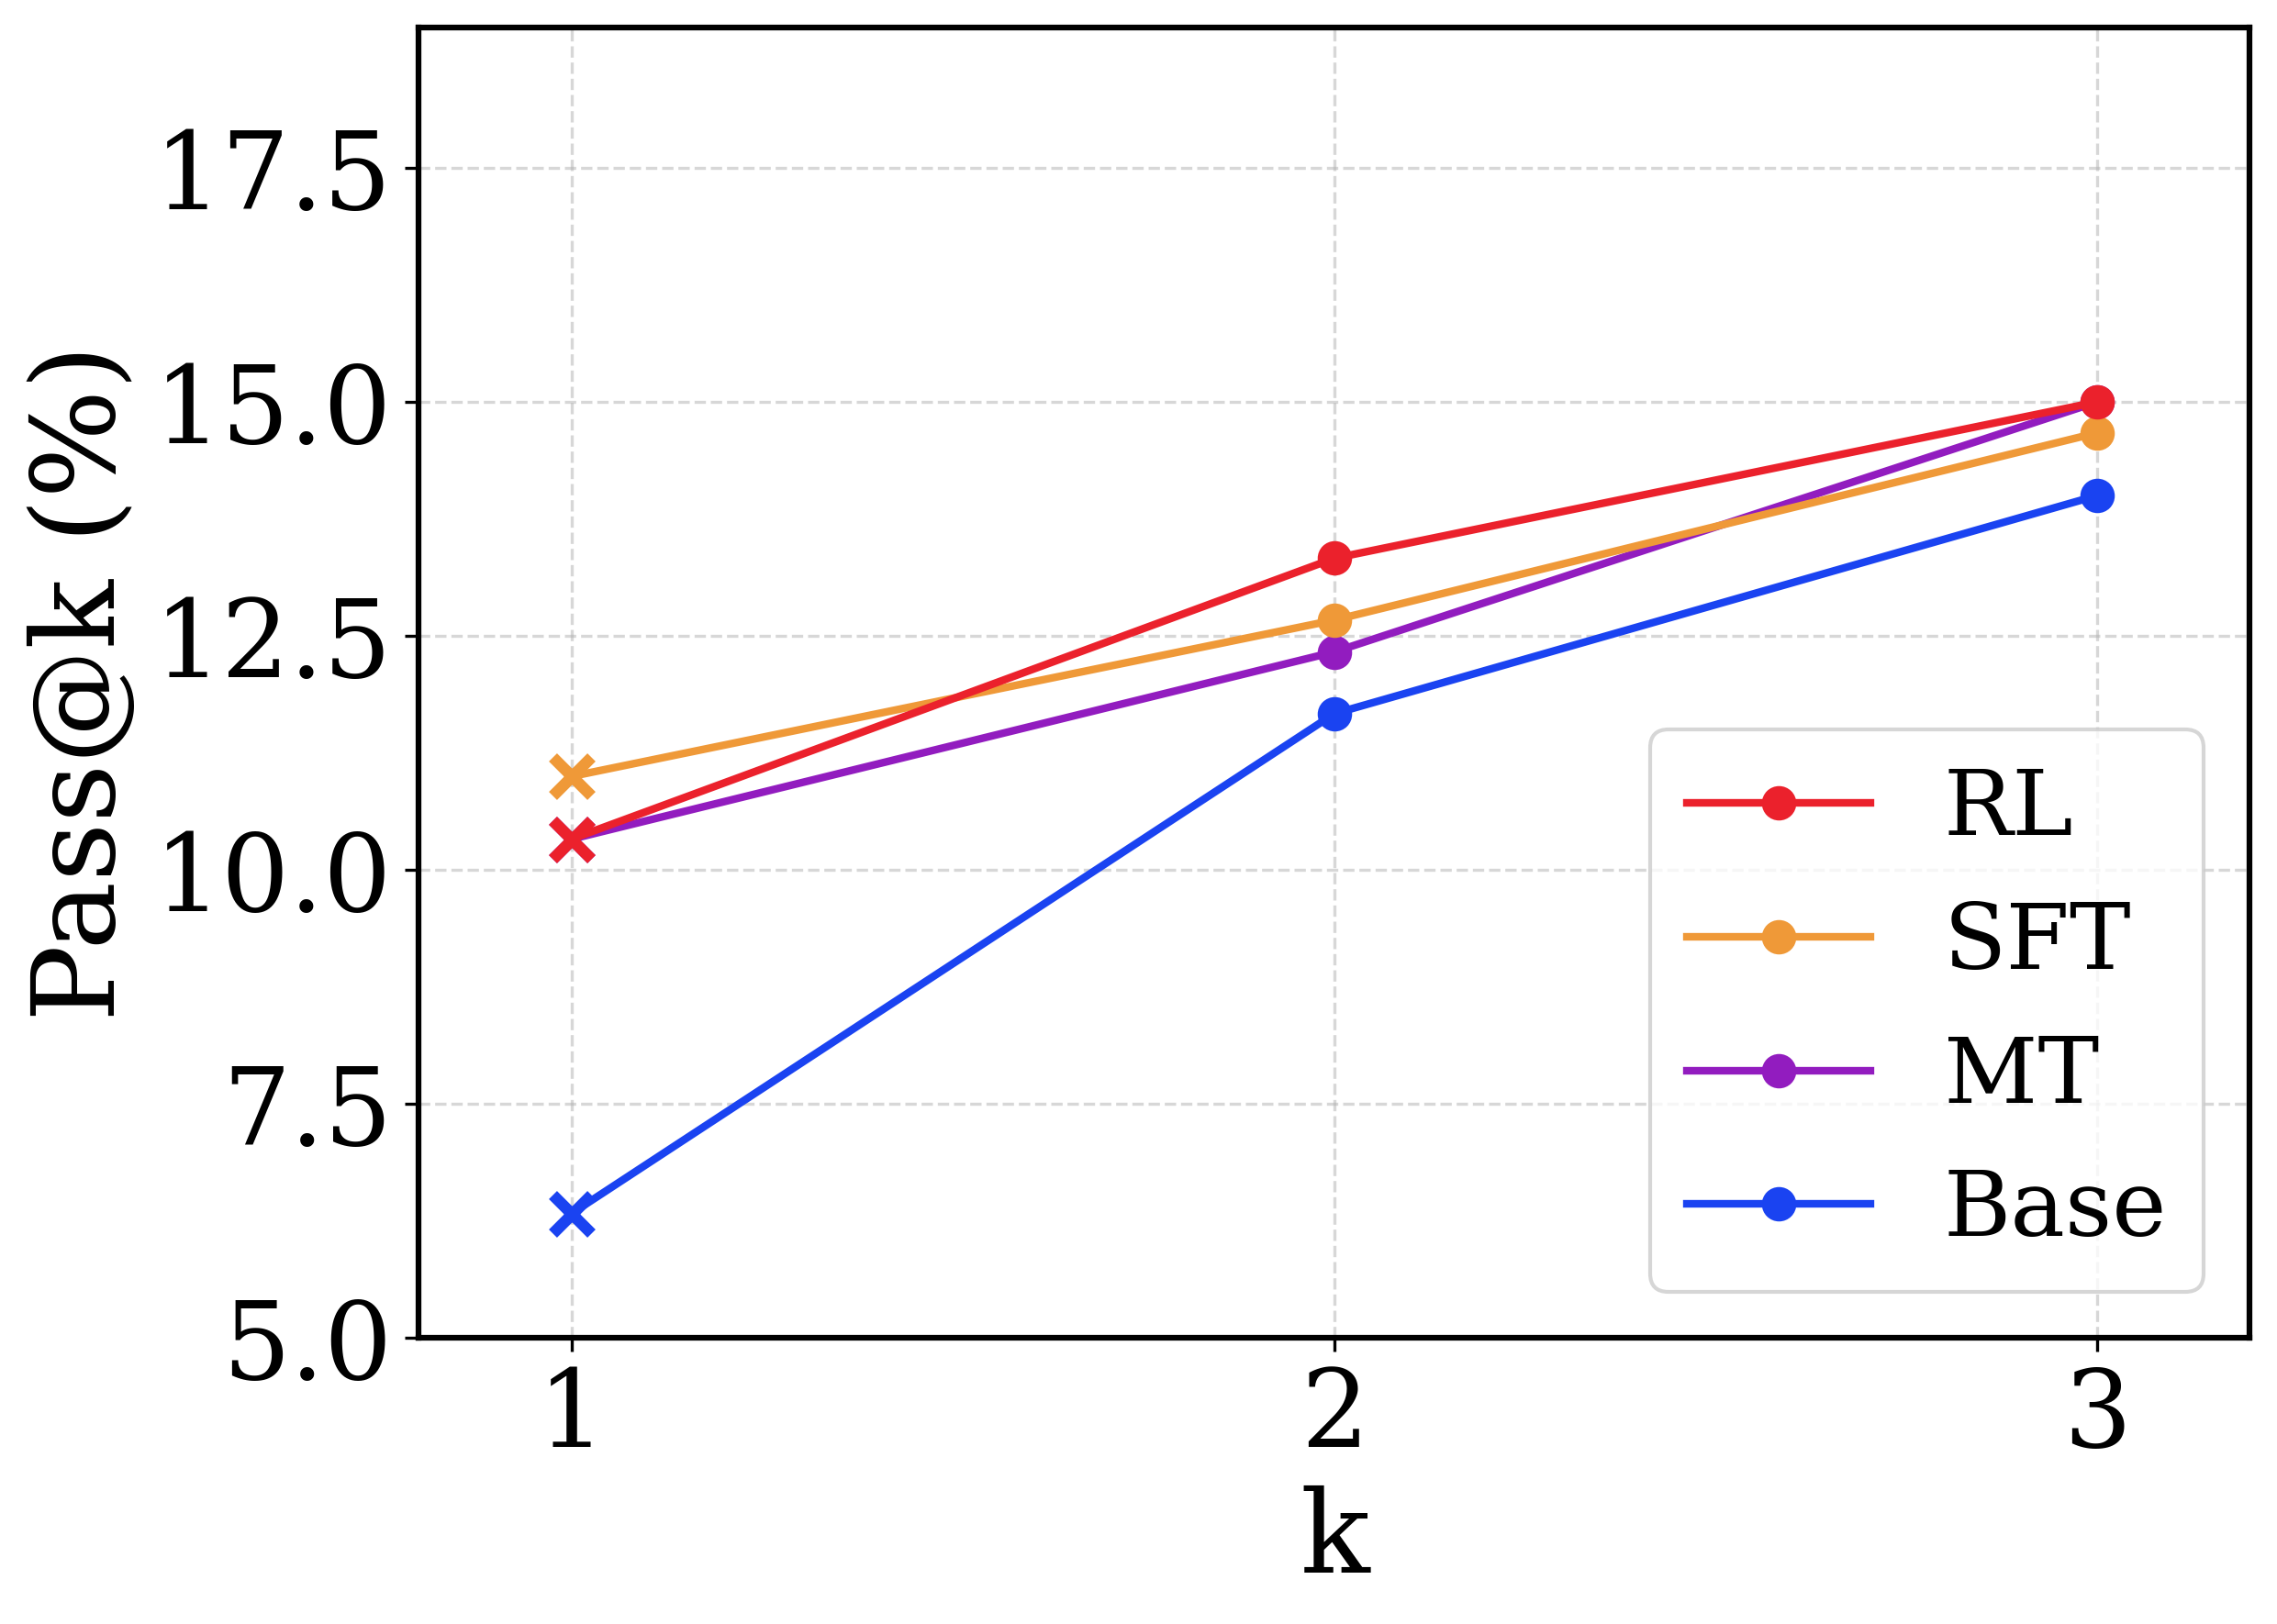
This image is a line chart comparing the performance of four different models or methodologies across three discrete attempts (k=1, 2, and 3). The performance is measured using a "Pass@k (%)" metric. All text in the image is in English.
### Components/Axes
**Component Isolation & Spatial Grounding:**
* **Y-Axis (Left edge):** Labeled "Pass@k (%)" (text is rotated 90 degrees counter-clockwise). The scale ranges from 5.0 to 17.5. Major tick marks and corresponding horizontal light-grey dashed gridlines are placed at intervals of 2.5: 5.0, 7.5, 10.0, 12.5, 15.0, and 17.5.
* **X-Axis (Bottom edge):** Labeled "k". The scale consists of discrete integer values. Major tick marks and corresponding vertical light-grey dashed gridlines are placed at: 1, 2, and 3.
* **Legend (Bottom-right quadrant):** Enclosed in a rounded rectangular box, positioned inside the chart area, avoiding intersection with the data lines. It maps four colors to specific labels:
* Red line with a circle marker: `RL`
* Orange line with a circle marker: `SFT`
* Purple line with a circle marker: `MT`
* Blue line with a circle marker: `Base`
* **Data Markers:** A notable visual distinction is made at `k=1`, where all data points are marked with an 'x' (cross). At `k=2` and `k=3`, all data points are marked with solid circles.
### Detailed Analysis
*Note: All numerical values extracted below are visual approximations based on the gridlines, with an estimated uncertainty of ±0.2%.*
**Trend Verification & Data Extraction:**
1. **Base (Blue Line)**
* *Trend:* The line slopes upward significantly from k=1 to k=2, showing the steepest rate of improvement among all series. The upward slope continues from k=2 to k=3, but at a slightly reduced trajectory. It remains the lowest-performing series across all values of k.
* *Data Points:*
* k=1: ~6.3% (Marker: x)
* k=2: ~11.7% (Marker: circle)
* k=3: ~14.0% (Marker: circle)
2. **MT (Purple Line)**
* *Trend:* The line slopes upward steadily. It begins closely tied with the RL series at k=1, falls slightly behind SFT and RL at k=2, and converges closely with the SFT series at k=3.
* *Data Points:*
* k=1: ~10.3% (Marker: x)
* k=2: ~12.3% (Marker: circle)
* k=3: ~14.6% (Marker: circle)
3. **RL (Red Line)**
* *Trend:* The line slopes upward steadily. It starts slightly below SFT at k=1, but exhibits a steeper slope between k=1 and k=2, allowing it to overtake all other series. It maintains the highest position at k=3.
* *Data Points:*
* k=1: ~10.3% (Marker: x)
* k=2: ~13.3% (Marker: circle)
* k=3: ~15.0% (Marker: circle)
4. **SFT (Orange Line)**
* *Trend:* The line slopes upward steadily. It begins as the highest-performing series at k=1. Its slope is less steep than RL, causing it to drop to the second-highest position at k=2 and k=3.
* *Data Points:*
* k=1: ~11.0% (Marker: x)
* k=2: ~12.7% (Marker: circle)
* k=3: ~14.7% (Marker: circle)
### Key Observations
* **Universal Improvement:** All four methodologies show improved performance as 'k' increases from 1 to 3.
* **Base Model Deficit:** The "Base" model performs significantly worse than the other three at k=1 (single-shot), but the gap narrows considerably by k=3.
* **Rank Shifting:** "SFT" is the best performer at k=1, but "RL" overtakes it at k=2 and extends its lead at k=3.
* **Convergence:** "MT" and "SFT" end up with nearly identical performance at k=3, despite "SFT" having a clear advantage at k=1.
### Interpretation
This chart likely represents the evaluation of Large Language Models (LLMs) on a generative task, such as code generation (e.g., HumanEval or MBPP benchmarks).
* **The Metric:** "Pass@k" measures the probability that at least one correct solution is found when the model is allowed to generate 'k' different responses. Naturally, as 'k' increases, the probability of success increases, which explains the universal upward trend.
* **The Labels:** The labels represent standard model training paradigms:
* **Base:** A foundational, pre-trained model without specific instruction tuning. Its poor k=1 performance indicates it struggles to give the right answer on the first try, but its sharp rise at k=2 and k=3 shows the underlying knowledge is present if allowed multiple attempts.
* **SFT (Supervised Fine-Tuning):** This model has been trained on specific examples. It excels at k=1, meaning it is highly reliable at giving a good answer on the very first attempt compared to the others.
* **RL (Reinforcement Learning - likely RLHF):** While slightly worse than SFT on the first attempt (k=1), RL scales better with multiple attempts. By k=3, it explores a wider or more effective variety of answers, resulting in the highest overall success rate.
* **MT (Multi-Task):** Performs solidly in the middle of the pack, tracking closely with SFT but generally slightly behind it until they converge at k=3.
* **Visual Design Choice:** The use of 'x' markers exclusively at k=1 is a deliberate design choice, likely to emphasize the "single-shot" or "greedy decoding" performance as a distinct baseline compared to the multi-sample evaluations at k=2 and k=3.