##Scatter Plot: System State Trajectory with Uncertainty Ellipses
### Overview
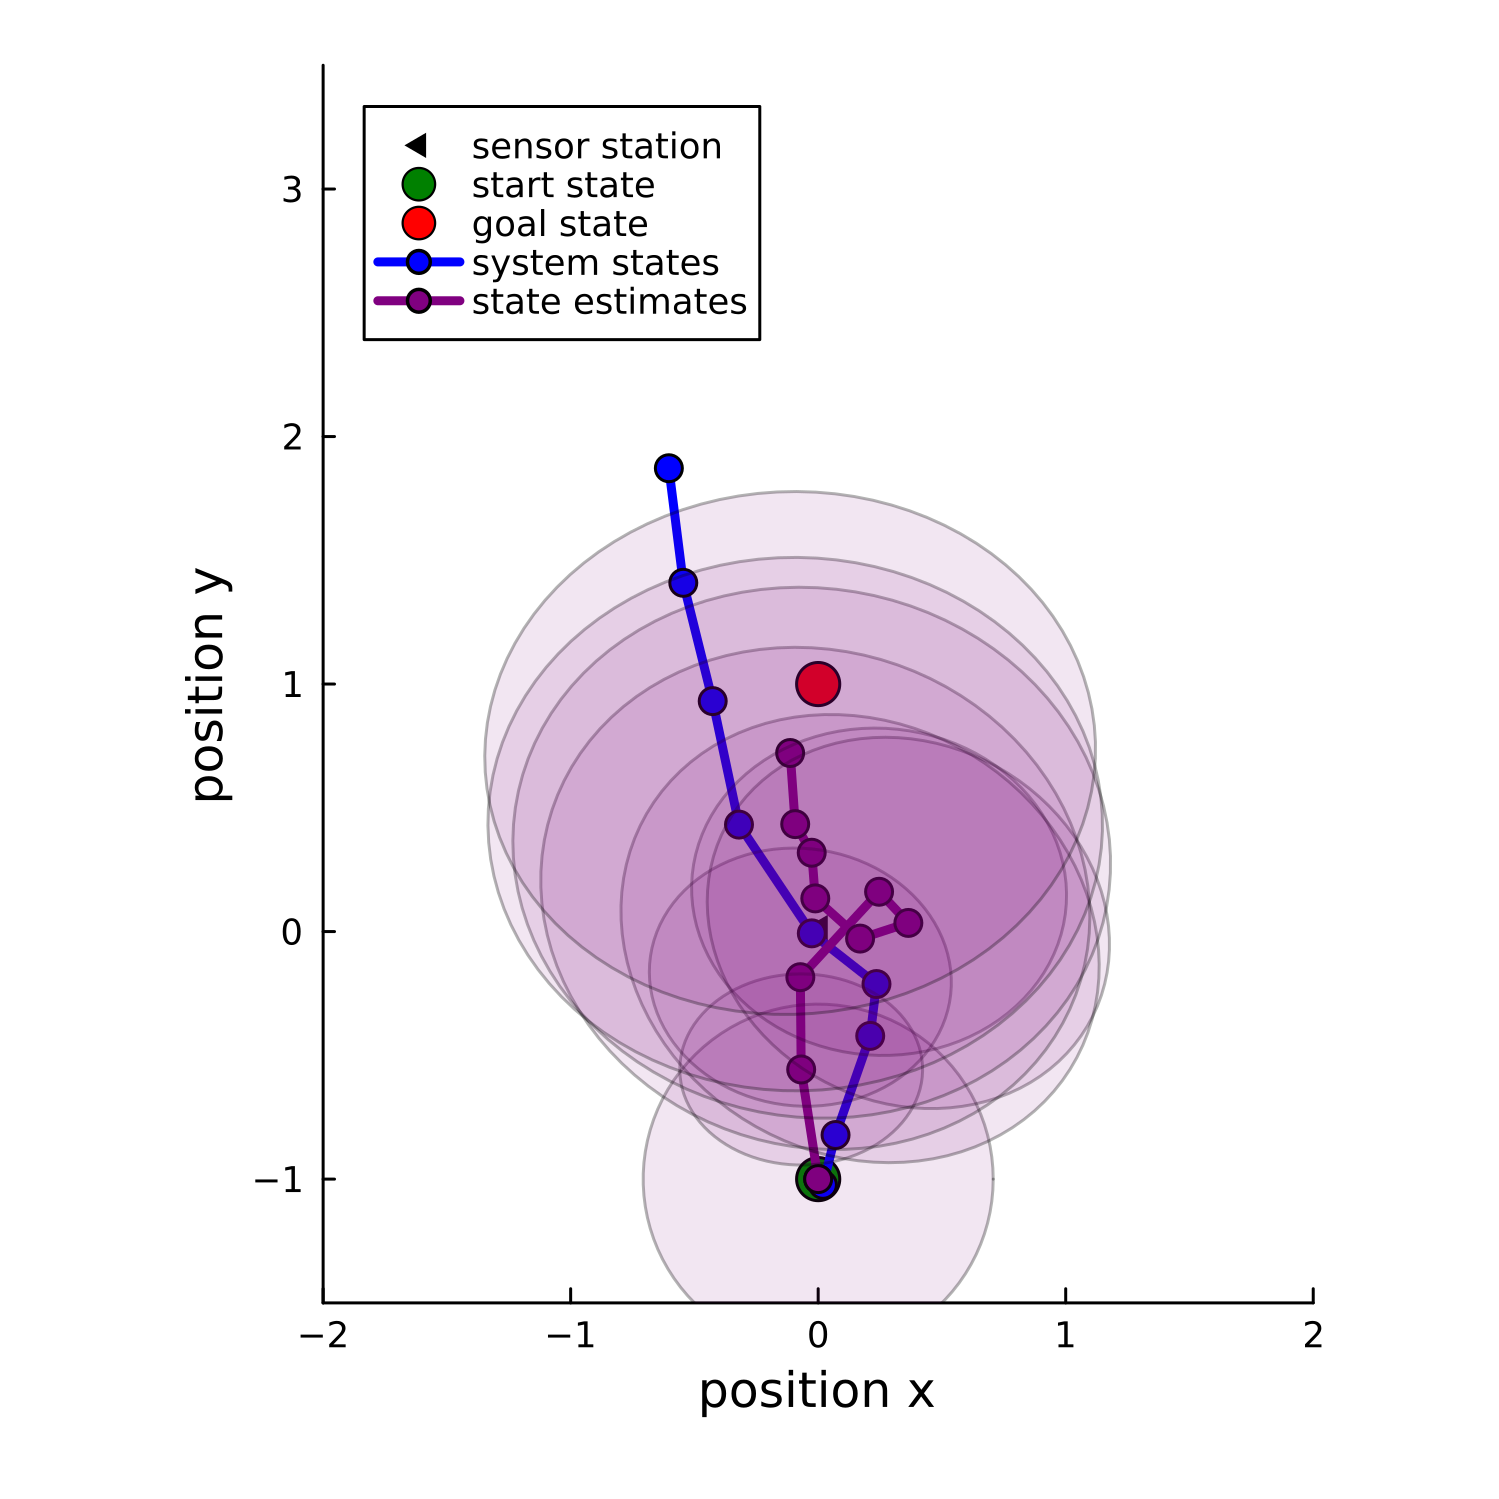
The image depicts a 2D coordinate system (x: -2 to 2, y: -1 to 3) showing a system's trajectory from a start state to a goal state. Key elements include sensor station markers, state estimates, and uncertainty ellipses. The plot combines discrete data points with probabilistic representations of system states.
### Components/Axes
- **Axes**:
- X-axis: "position x" (-2 to 2)
- Y-axis: "position y" (-1 to 3)
- **Legend** (top-left):
- △: Sensor station
- ● (green): Start state
- ● (red): Goal state
- ● (blue): System states
- ● (purple): State estimates
- **Ellipses**: Gray contour lines representing uncertainty regions
### Detailed Analysis
1. **Sensor Station**:
- Position: (-1, -1) (green triangle)
- Spatial relationship: Located southwest of the trajectory path
2. **Start State**:
- Position: (0, -1) (green circle)
- Uncertainty: Smallest ellipse (radius ~0.2 units)
3. **Goal State**:
- Position: (1, 1) (red circle)
- Uncertainty: Medium ellipse (radius ~0.3 units)
4. **System States**:
- Trajectory: Blue line connecting start (0,-1) to goal (1,1)
- Intermediate points:
- (0.5, 0.5)
- (0.75, 0.75)
- Path characteristics: Linear progression with consistent slope (Δy/Δx = 1)
5. **State Estimates**:
- Distribution:
- Clustered around start (0,-1) and goal (1,1)
- 3 points along trajectory path (0.25,0.25), (0.5,0.5), (0.75,0.75)
- 2 outliers near (0.5,0.25) and (0.75,0.75)
- Uncertainty:
- Largest ellipses (~0.5 units radius) near start/goal
- Smaller ellipses (~0.2 units) along trajectory
### Key Observations
1. **Trajectory Certainty**:
- System states follow a straight path (y=x-1) between start and goal
- State estimates align with this path but show minor deviations
2. **Uncertainty Patterns**:
- Highest uncertainty at start/goal states (larger ellipses)
- Reduced uncertainty along the trajectory path
3. **Sensor Station Role**:
- Positioned outside the trajectory path
- May serve as reference point for state estimation
### Interpretation
This visualization represents a probabilistic path planning scenario where:
- The system moves from start (0,-1) to goal (1,1) along y=x-1
- State estimates (purple points) show both planned trajectory points and potential deviations
- Uncertainty ellipses suggest:
- Measurement noise in position tracking
- Potential for path deviation near start/goal
- Higher confidence in mid-trajectory positions
- The sensor station's position (-1,-1) may indicate:
- A fixed reference point for state estimation
- Potential obstacle or environmental feature
The plot demonstrates a trade-off between trajectory accuracy (linear path) and positional uncertainty (ellipse sizes), with the system showing greatest confidence in its mid-path positions.