## Line Chart: Attention over Values, a=256
### Overview
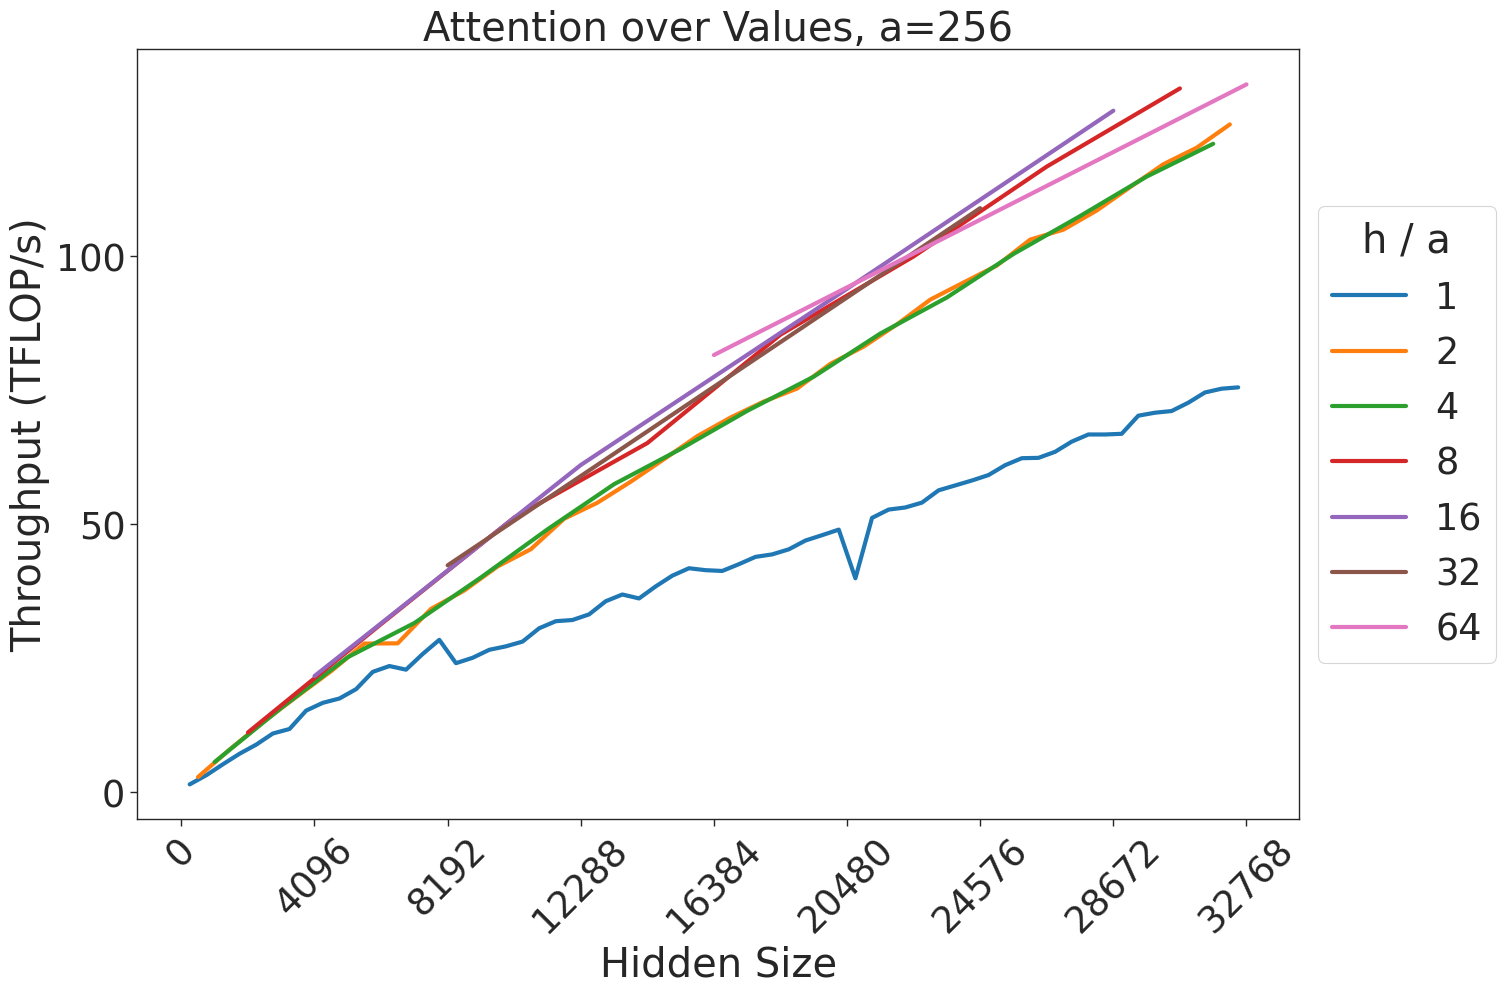
This image is a line chart illustrating the relationship between "Hidden Size" (x-axis) and "Throughput (TFLOP/s)" (y-axis) for an attention mechanism, likely within a neural network architecture. The chart displays multiple data series, each representing a different ratio of "h / a" (heads to attention dimension). The chart demonstrates that throughput generally increases with hidden size, but the rate of increase and the maximum throughput achieved vary significantly based on the "h / a" ratio.
### Components/Axes
* **Title:** "Attention over Values, a=256" (Top center).
* **X-Axis:** Labeled "Hidden Size". The scale ranges from 0 to 32768. Major ticks are at 0, 4096, 8192, 12288, 16384, 20480, 24576, 28672, 32768.
* **Y-Axis:** Labeled "Throughput (TFLOP/s)". The scale ranges from 0 to >100. Major ticks are at 0, 50, 100.
* **Legend:** Located on the right side of the chart. It defines the "h / a" ratio for each colored line:
* **Blue:** 1
* **Orange:** 2
* **Green:** 4
* **Red:** 8
* **Purple:** 16
* **Brown:** 32
* **Pink:** 64
### Detailed Analysis
The chart displays seven distinct data series. All series exhibit a positive correlation between Hidden Size and Throughput.
* **Blue Line (h/a = 1):**
* **Trend:** Starts at (0,0) and slopes upward. It is the lowest-performing series across the entire range.
* **Data Points:** Reaches ~25 TFLOP/s at 8192, ~40 TFLOP/s at 16384, and ends at ~75 TFLOP/s at 32768.
* **Anomaly:** There is a sharp, distinct dip in throughput at Hidden Size 20480, where the value drops significantly before recovering.
* **Orange (h/a = 2) and Green (h/a = 4) Lines:**
* **Trend:** These two lines are nearly identical and overlap significantly. They start at (0,0) and rise steadily.
* **Data Points:** They reach ~50 TFLOP/s at 8192, ~100 TFLOP/s at 24576, and end at ~125 TFLOP/s at 32768.
* **Red (h/a = 8), Purple (h/a = 16), and Brown (h/a = 32) Lines:**
* **Trend:** These lines start at higher Hidden Sizes (approximately 4096 to 8192) and exhibit a steeper upward slope than the blue, orange, and green lines.
* **Data Points:** They converge toward the top right of the chart, ending at approximately 130–135 TFLOP/s at 32768.
* **Pink Line (h/a = 64):**
* **Trend:** This line starts at the highest Hidden Size relative to the others (starts at 16384).
* **Data Points:** It shows the highest throughput at the end of the range, reaching ~135 TFLOP/s at 32768.
### Key Observations
* **Performance Saturation:** As the "h / a" ratio increases, the throughput increases, but the marginal gains diminish. The lines for h/a = 8, 16, 32, and 64 are clustered very closely together at the top of the chart.
* **The "Blue" Outlier:** The h/a = 1 configuration is significantly less efficient than all other configurations.
* **The Dip:** The sharp drop in the blue line at 20480 is a notable anomaly, suggesting a specific hardware or software bottleneck (e.g., cache alignment or memory access pattern) occurring at that specific hidden size for that specific configuration.
* **Starting Points:** Higher "h / a" ratios appear to require a minimum "Hidden Size" threshold before they can be utilized or plotted, as evidenced by the lines starting further to the right on the x-axis.
### Interpretation
This chart is a performance benchmark for a GPU-accelerated attention kernel.
* **"a=256"** likely refers to the dimension of the attention head.
* **"h"** refers to the number of attention heads.
* **"h/a"** represents the ratio of heads to the head dimension.
The data demonstrates that for a fixed head dimension (a=256), increasing the number of heads (h) generally improves throughput, likely due to better parallelization and occupancy on the GPU. However, this improvement hits a point of diminishing returns where increasing the ratio further (e.g., from 32 to 64) yields negligible performance gains. The anomaly at 20480 for h/a=1 is a classic indicator of a "cliff" in performance, often caused by memory bank conflicts or non-optimal thread block scheduling for that specific matrix size.