TECHNICAL ASSET FINGERPRINT
6eb241572b69845aebcccaea
Click to view fullscreen
Press ESC or click to close
FOUND IN PAPERS
EXPERT: healer-alpha-free VERSION 1
RUNTIME: free/openrouter/healer-alpha
INTEL_VERIFIED
## Bar Chart Composite: AI Model Benchmark Performance
### Overview
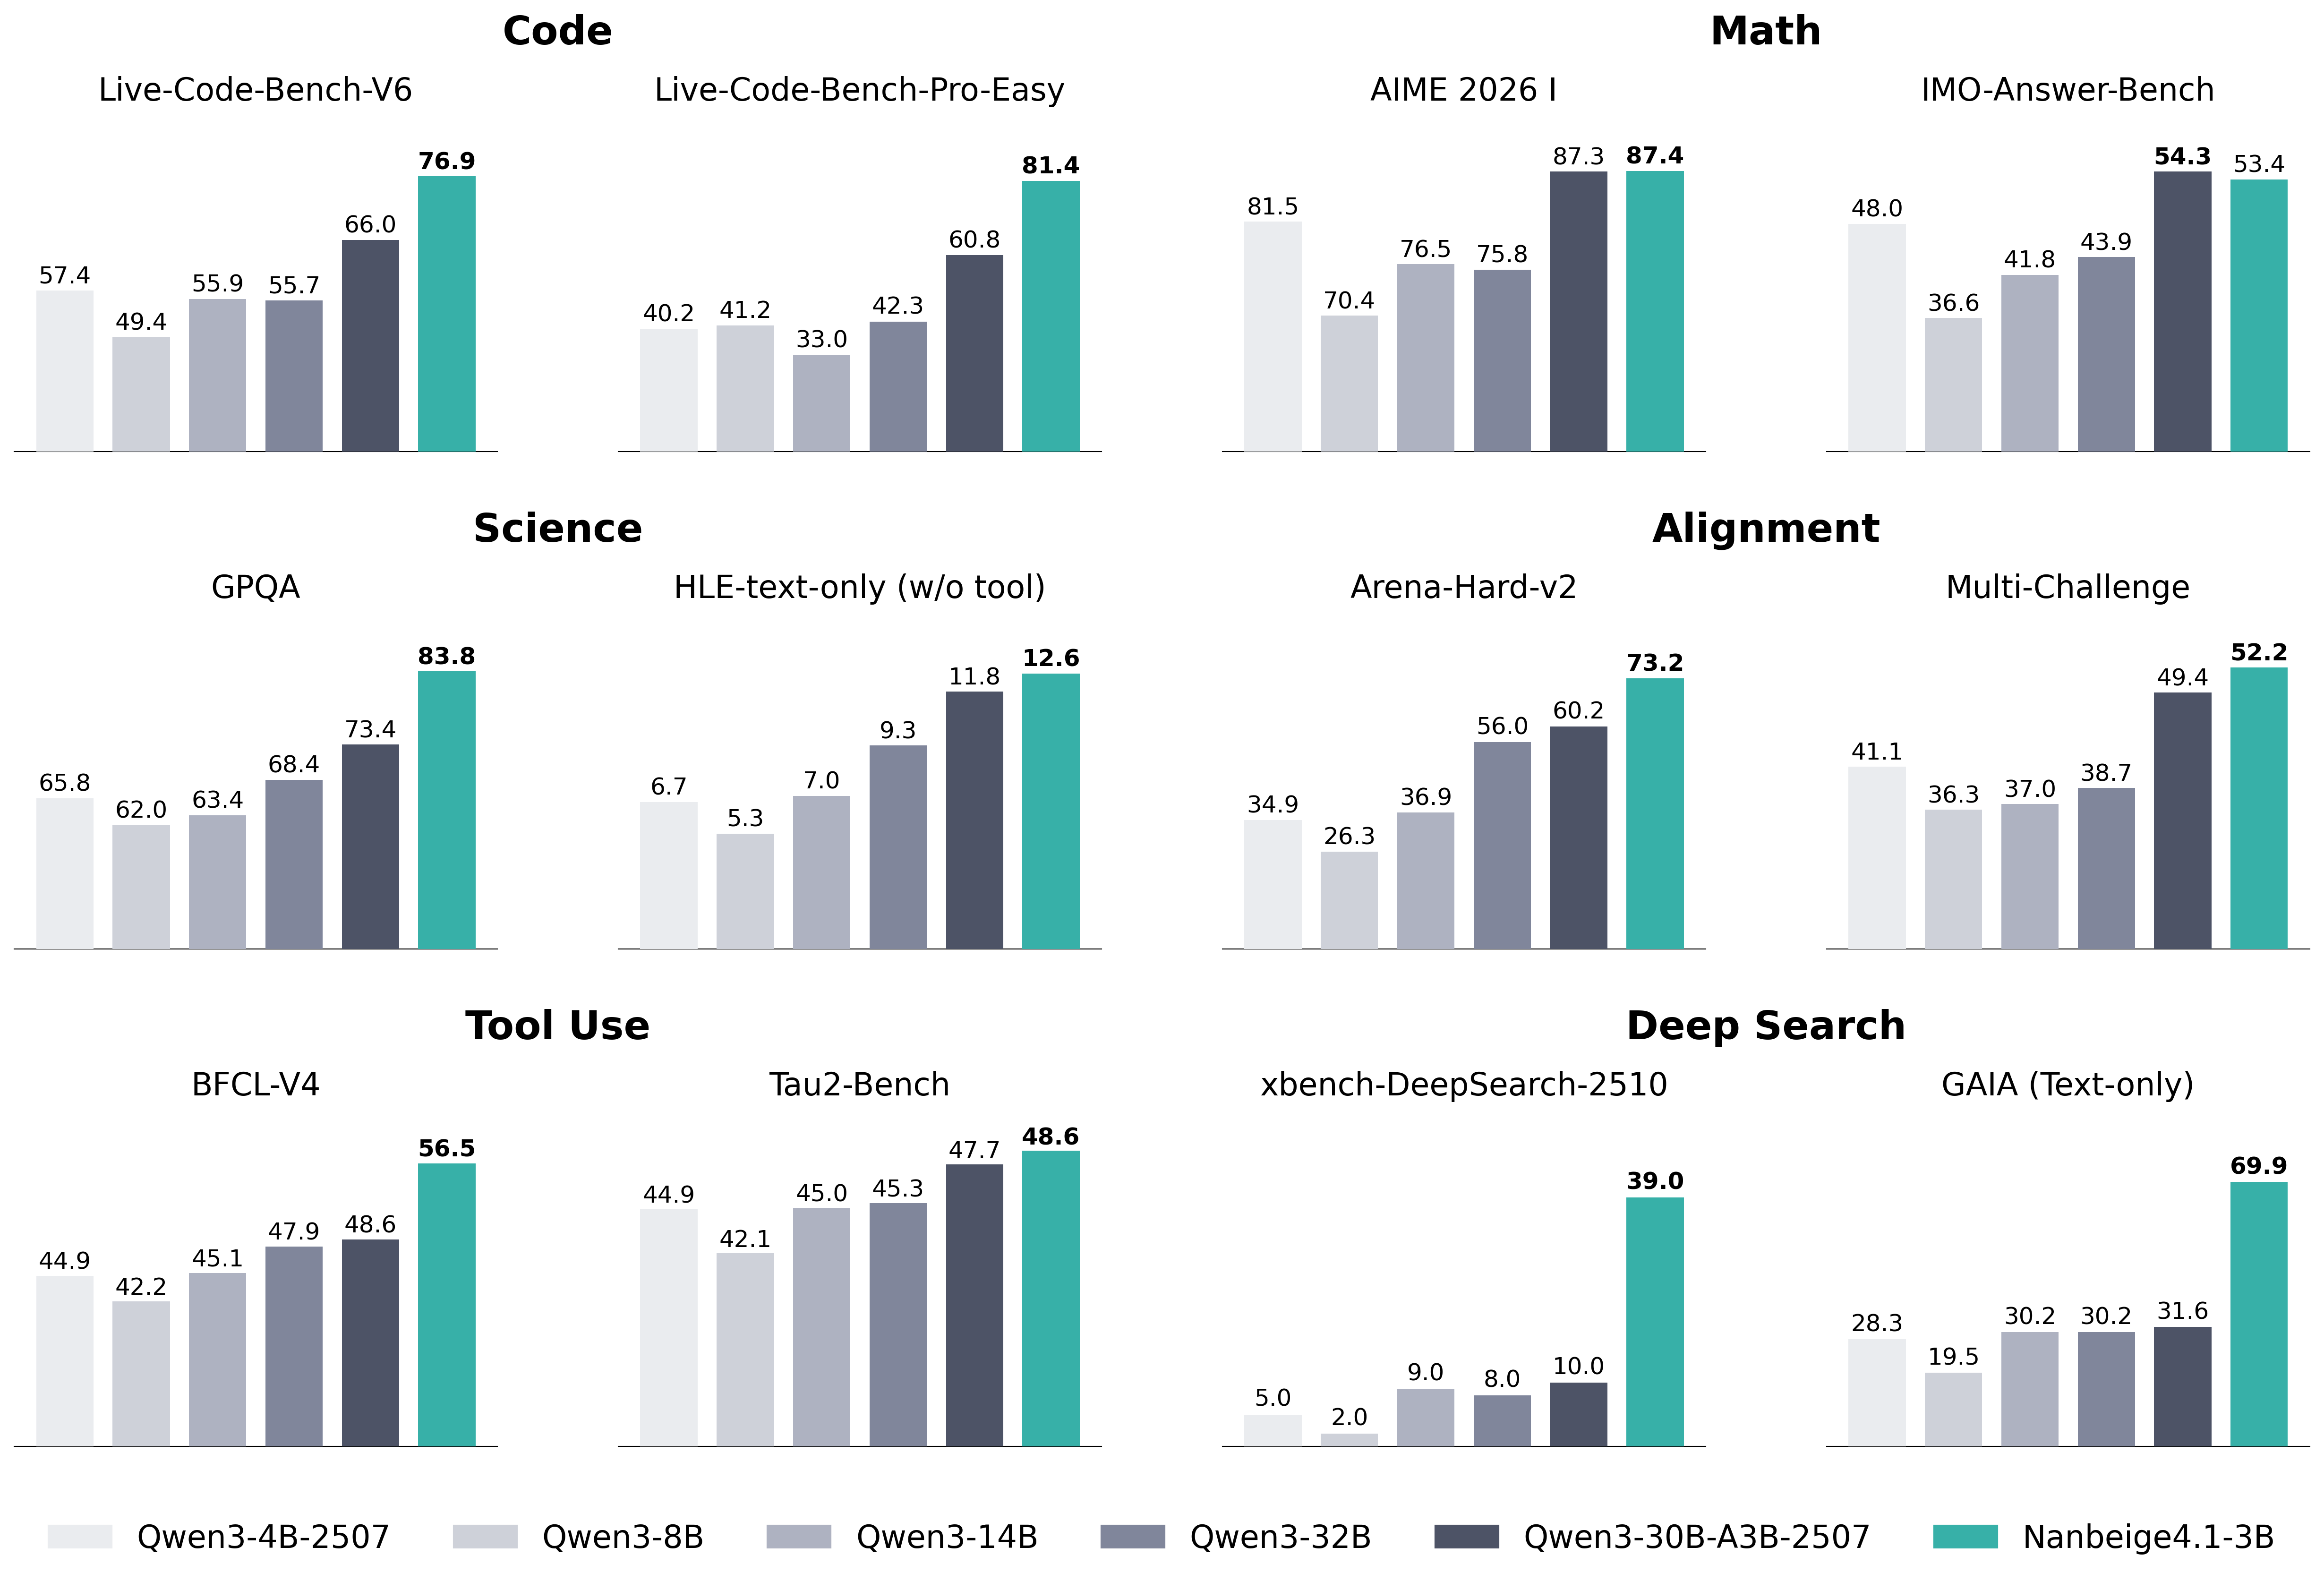
The image is a composite of 12 bar charts organized into six thematic categories, comparing the performance of six different AI models across various technical benchmarks. The charts are arranged in a 3x4 grid (three rows, four columns). Each individual chart represents a specific benchmark, with bars showing the performance score (likely a percentage or normalized metric) for each model. The models are consistently color-coded across all charts, with a legend provided at the bottom.
### Components/Axes
* **Legend (Bottom Center):** A horizontal legend maps colors to model names. From left to right:
* Lightest Grey: `Qwen3-4B-2507`
* Light Grey: `Qwen3-8B`
* Medium Grey: `Qwen3-14B`
* Dark Grey: `Qwen3-32B`
* Darkest Grey/Blue: `Qwen3-30B-A3B-2507`
* Teal/Green: `Nanbeige4.1-3B`
* **Chart Categories (Row Headers):** The six main categories are labeled in bold at the top of their respective chart groups:
* **Code** (Top Left)
* **Math** (Top Right)
* **Science** (Middle Left)
* **Alignment** (Middle Right)
* **Tool Use** (Bottom Left)
* **Deep Search** (Bottom Right)
* **Individual Benchmark Titles:** Each of the 12 charts has a specific title above its bars.
* **Y-Axis:** Not explicitly labeled with a title or scale. The numerical value for each bar is printed directly above it, serving as the data point.
* **X-Axis:** Represents the different models for each benchmark. The model order is consistent within each chart, matching the legend order from left to right.
### Detailed Analysis
Performance scores for each model across all 12 benchmarks are extracted below. The trend within each chart is described first, followed by the precise data points.
**1. Code Category**
* **Live-Code-Bench-V6:** A generally increasing trend from left to right, with a significant jump for the final two models.
* Qwen3-4B-2507: 57.4
* Qwen3-8B: 49.4
* Qwen3-14B: 55.9
* Qwen3-32B: 55.7
* Qwen3-30B-A3B-2507: 66.0
* Nanbeige4.1-3B: 76.9
* **Live-Code-Bench-Pro-Easy:** A clear upward trend, with Nanbeige4.1-3B showing a dominant lead.
* Qwen3-4B-2507: 40.2
* Qwen3-8B: 41.2
* Qwen3-14B: 33.0
* Qwen3-32B: 42.3
* Qwen3-30B-A3B-2507: 60.8
* Nanbeige4.1-3B: 81.4
**2. Math Category**
* **AIME 2026 I:** A U-shaped trend, with the first model scoring high, a dip in the middle models, and the highest scores from the last two models.
* Qwen3-4B-2507: 81.5
* Qwen3-8B: 70.4
* Qwen3-14B: 76.5
* Qwen3-32B: 75.8
* Qwen3-30B-A3B-2507: 87.3
* Nanbeige4.1-3B: 87.4
* **IMO-Answer-Bench:** A steady upward trend, with the final two models performing significantly better.
* Qwen3-4B-2507: 48.0
* Qwen3-8B: 36.6
* Qwen3-14B: 41.8
* Qwen3-32B: 43.9
* Qwen3-30B-A3B-2507: 54.3
* Nanbeige4.1-3B: 53.4
**3. Science Category**
* **GPQA:** A consistent upward trend from left to right.
* Qwen3-4B-2507: 65.8
* Qwen3-8B: 62.0
* Qwen3-14B: 63.4
* Qwen3-32B: 68.4
* Qwen3-30B-A3B-2507: 73.4
* Nanbeige4.1-3B: 83.8
* **HLE-text-only (w/o tool):** A clear upward trend, with all scores being relatively low (single digits to low teens).
* Qwen3-4B-2507: 6.7
* Qwen3-8B: 5.3
* Qwen3-14B: 7.0
* Qwen3-32B: 9.3
* Qwen3-30B-A3B-2507: 11.8
* Nanbeige4.1-3B: 12.6
**4. Alignment Category**
* **Arena-Hard-v2:** A strong upward trend, with the final model having a substantial lead.
* Qwen3-4B-2507: 34.9
* Qwen3-8B: 26.3
* Qwen3-14B: 36.9
* Qwen3-32B: 56.0
* Qwen3-30B-A3B-2507: 60.2
* Nanbeige4.1-3B: 73.2
* **Multi-Challenge:** A gradual upward trend, with the final model leading.
* Qwen3-4B-2507: 41.1
* Qwen3-8B: 36.3
* Qwen3-14B: 37.0
* Qwen3-32B: 38.7
* Qwen3-30B-A3B-2507: 49.4
* Nanbeige4.1-3B: 52.2
**5. Tool Use Category**
* **BFCL-V4:** A steady upward trend.
* Qwen3-4B-2507: 44.9
* Qwen3-8B: 42.2
* Qwen3-14B: 45.1
* Qwen3-32B: 47.9
* Qwen3-30B-A3B-2507: 48.6
* Nanbeige4.1-3B: 56.5
* **Tau2-Bench:** A relatively flat trend for the first four models, followed by a slight increase for the last two.
* Qwen3-4B-2507: 44.9
* Qwen3-8B: 42.1
* Qwen3-14B: 45.0
* Qwen3-32B: 45.3
* Qwen3-30B-A3B-2507: 47.7
* Nanbeige4.1-3B: 48.6
**6. Deep Search Category**
* **xbench-DeepSearch-2510:** A very low, flat trend for the first five models, with a dramatic, isolated spike for the final model.
* Qwen3-4B-2507: 5.0
* Qwen3-8B: 2.0
* Qwen3-14B: 9.0
* Qwen3-32B: 8.0
* Qwen3-30B-A3B-2507: 10.0
* Nanbeige4.1-3B: 39.0
* **GAIA (Text-only):** A U-shaped trend, with the first model scoring moderately, a dip for the second, and a strong upward trend for the remaining models, culminating in a dominant score for the final model.
* Qwen3-4B-2507: 28.3
* Qwen3-8B: 19.5
* Qwen3-14B: 30.2
* Qwen3-32B: 30.2
* Qwen3-30B-A3B-2507: 31.6
* Nanbeige4.1-3B: 69.9
### Key Observations
1. **Dominant Model:** The `Nanbeige4.1-3B` model (teal bar) is the top performer in **11 out of 12** benchmarks. Its lead is particularly extreme in `xbench-DeepSearch-2510` (39.0 vs. next best 10.0) and `GAIA (Text-only)` (69.9 vs. next best 31.6).
2. **Strong Runner-up:** The `Qwen3-30B-A3B-2507` model (darkest grey/blue) is consistently the second-best performer, often closely trailing `Nanbeige4.1-3B`.
3. **Performance Tiers:** A clear hierarchy is visible: `Nanbeige4.1-3B` > `Qwen3-30B-A3B-2507` > `Qwen3-32B` > `Qwen3-14B` ≈ `Qwen3-4B-2507` > `Qwen3-8B`. The `Qwen3-8B` model is frequently the lowest or among the lowest performers.
4. **Benchmark Difficulty:** The `HLE-text-only` and `xbench-DeepSearch-2510` benchmarks yield very low scores for most models, suggesting they are significantly more challenging or measure a capability where most models struggle.
5. **Anomaly:** The `AIME 2026 I` benchmark shows the smallest performance gap between the top two models (87.3 vs. 87.4), indicating near-parity on this specific math task.
### Interpretation
This composite chart provides a comparative snapshot of AI model capabilities across a diverse set of technical and reasoning tasks. The data strongly suggests that the `Nanbeige4.1-3B` model represents a significant advancement, demonstrating superior performance across code generation, mathematical reasoning, scientific question-answering, alignment evaluations, tool use, and deep search tasks.
The consistent underperformance of the `Qwen3-8B` model relative to its larger counterparts (`14B`, `32B`) aligns with the general expectation that model scale correlates with capability. However, the exceptional performance of `Nanbeige4.1-3B`—which, based on its name, may not be the largest model—hints at potential architectural or training efficiencies that allow it to outperform larger models in the Qwen3 series.
The dramatic outliers in the "Deep Search" category are particularly noteworthy. They suggest that `Nanbeige4.1-3B` possesses a unique and highly effective capability for complex information retrieval and synthesis that the other models lack almost entirely. This could indicate a specialized training focus or a breakthrough in that specific domain.
Overall, the visualization serves as a benchmark report card, positioning `Nanbeige4.1-3B` as the current leader across this broad evaluation suite, with `Qwen3-30B-A3B-2507` as a strong competitor. The results would be critical for researchers and developers in selecting models for specific applications, especially those requiring deep search, advanced coding, or complex reasoning.
DECODING INTELLIGENCE...