\n
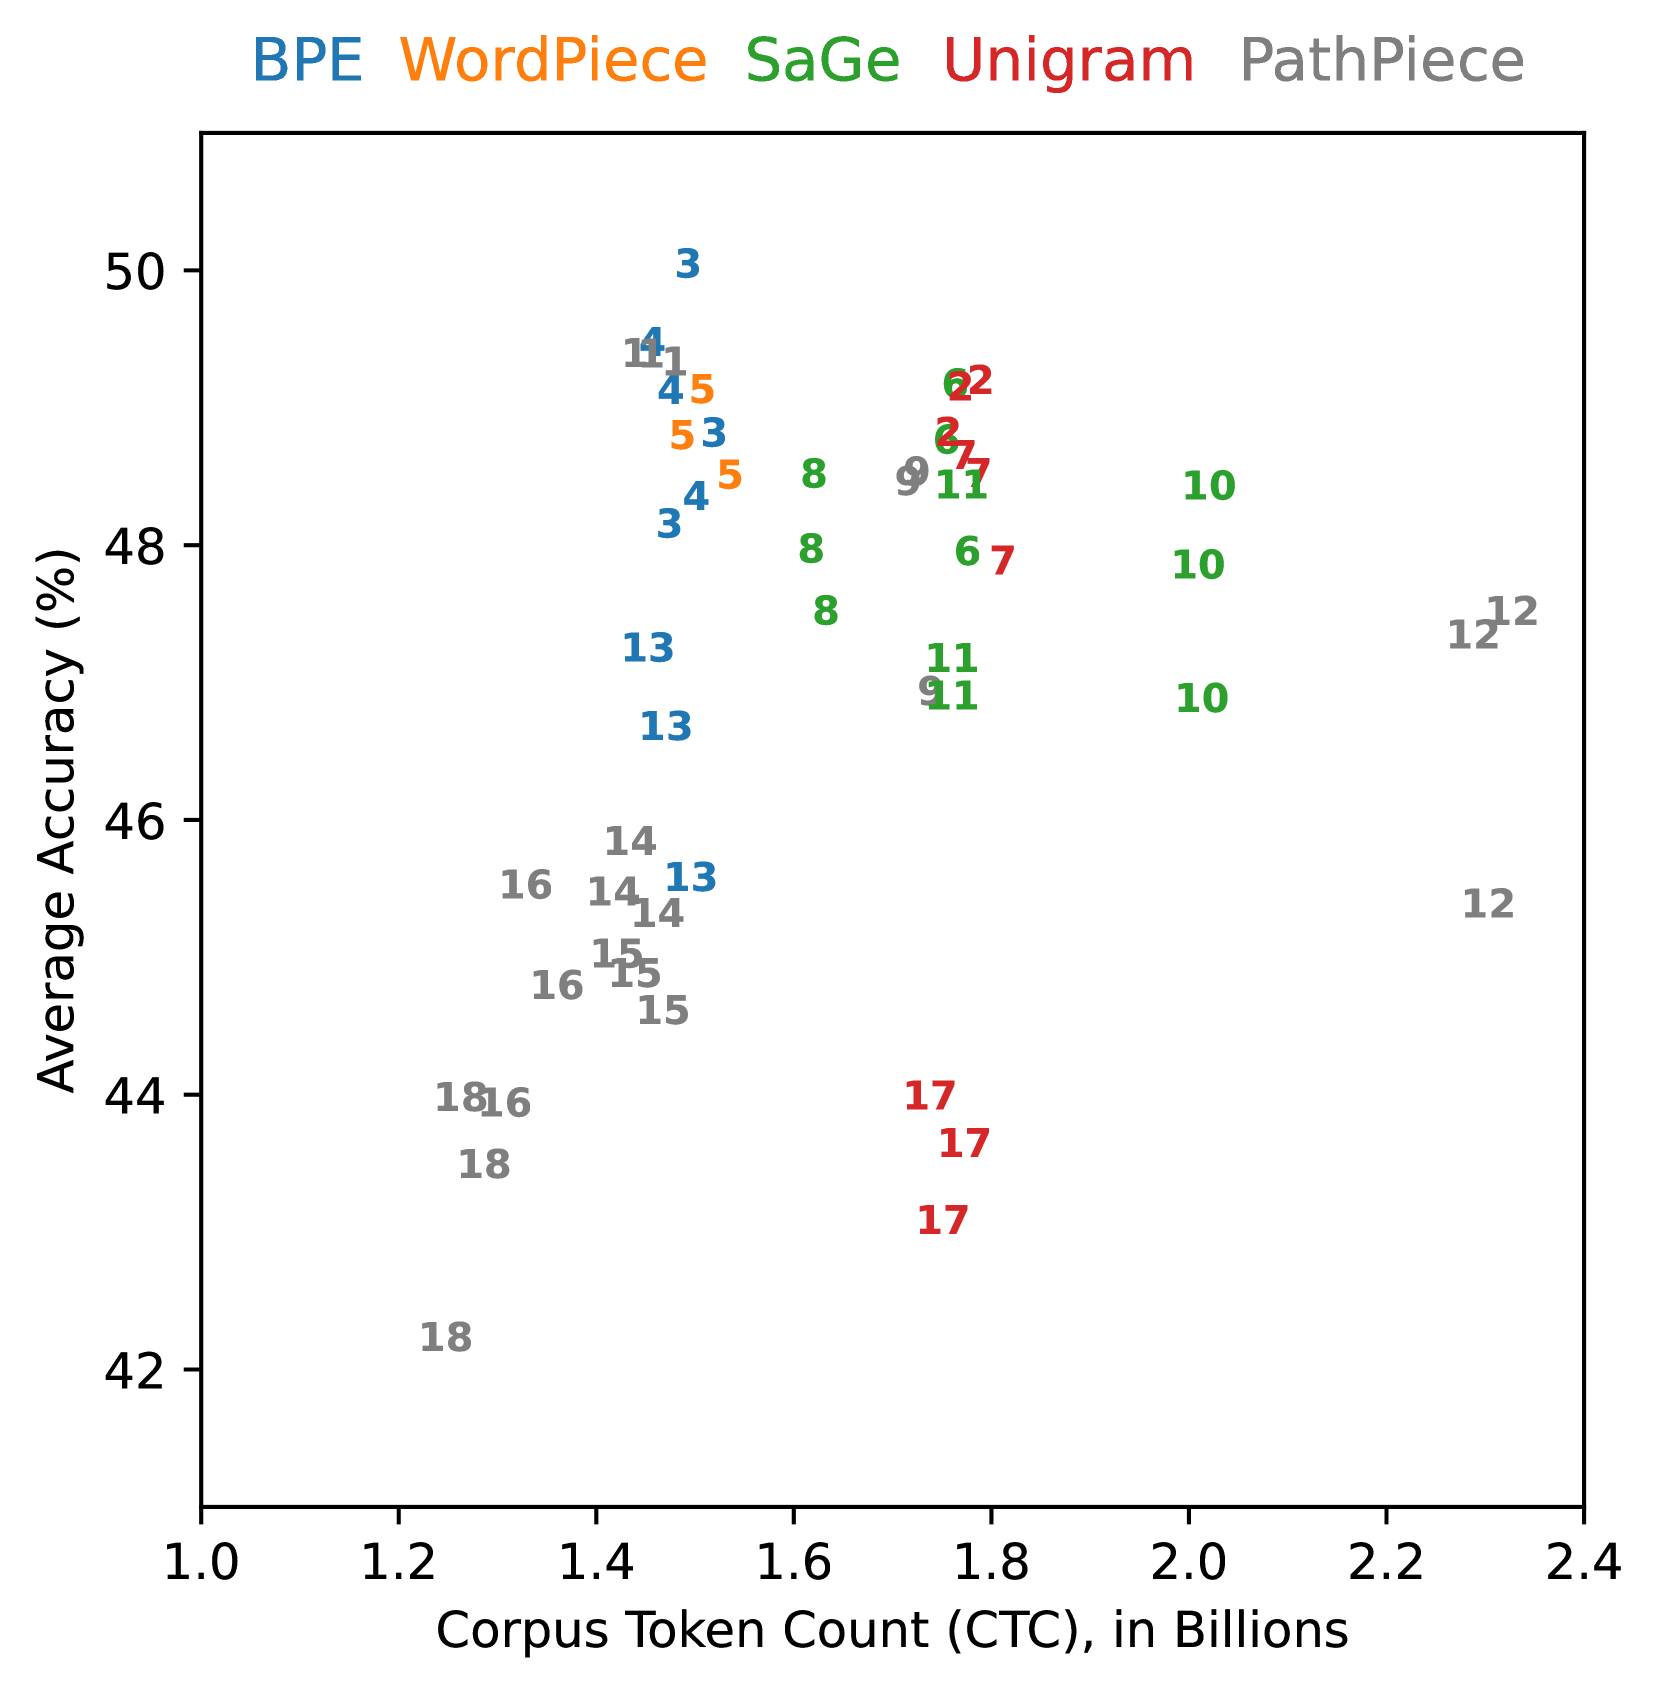
## Scatter Plot: Tokenization Method Performance vs. Corpus Token Count
### Overview
This image is a scatter plot comparing the performance of five different tokenization methods. The chart plots "Average Accuracy (%)" against "Corpus Token Count (CTC), in Billions." Each data point is labeled with a number, likely representing a specific configuration or experiment ID for that method. The data points are color-coded according to the tokenization method, as indicated by the legend at the top of the chart.
### Components/Axes
* **Y-Axis:** Labeled "Average Accuracy (%)". The scale runs from 42 to 50, with major tick marks at 42, 44, 46, 48, and 50.
* **X-Axis:** Labeled "Corpus Token Count (CTC), in Billions". The scale runs from 1.0 to 2.4, with major tick marks at 1.0, 1.2, 1.4, 1.6, 1.8, 2.0, 2.2, and 2.4.
* **Legend:** Positioned at the top-center of the chart, above the plot area. It lists five tokenization methods, each associated with a specific color:
* **BPE** (Blue)
* **WordPiece** (Orange)
* **SaGe** (Green)
* **Unigram** (Red)
* **PathPiece** (Gray)
* **Data Points:** Each point on the scatter plot is represented by a colored number. The number corresponds to a specific experiment or configuration for the method indicated by its color.
### Detailed Analysis
The plot reveals distinct clustering and ranges for each tokenization method:
* **BPE (Blue):** Points are clustered in a relatively narrow band of Corpus Token Count (CTC), approximately between 1.4 and 1.6 billion. Their Average Accuracy ranges from about 46% to 50%. The highest accuracy point on the entire chart (≈50%) belongs to BPE (labeled "3").
* **WordPiece (Orange):** Points are tightly clustered near a CTC of 1.5 billion, with Average Accuracy between approximately 48% and 49%.
* **SaGe (Green):** Points are spread across a wider CTC range, from about 1.6 to 2.0 billion. Their Average Accuracy is generally high, clustering between 47% and 49%.
* **Unigram (Red):** Points are found in two distinct clusters. One cluster is at a CTC of approximately 1.7-1.8 billion with high accuracy (≈49%). A second, separate cluster is at a similar CTC (≈1.7-1.8 billion) but with significantly lower accuracy, between 43% and 44% (points labeled "17").
* **PathPiece (Gray):** This method shows the widest dispersion. Points are scattered across nearly the entire X-axis range, from a CTC of ~1.2 billion to ~2.3 billion. Correspondingly, its Average Accuracy varies dramatically, from a low of ~42% (point "18" at ~1.2 billion CTC) to a high of ~49% (points "11" and "12" at ~1.4 and ~2.3 billion CTC, respectively).
### Key Observations
1. **Performance-Accuracy Trade-off:** There is no simple linear trade-off between Corpus Token Count and Average Accuracy. High accuracy can be achieved across a range of CTC values (1.4 to 2.0 billion) by different methods.
2. **Method-Specific Clustering:** Each method (except PathPiece) occupies a somewhat distinct region of the plot, suggesting inherent characteristics in how they tokenize data, affecting both count and resulting model accuracy.
3. **Unigram Bimodality:** The Unigram method exhibits a clear bimodal distribution, with one group performing at the top tier of accuracy and another group performing near the bottom. This suggests the existence of two very different configurations or outcomes for this method.
4. **PathPiece Variability:** PathPiece demonstrates the highest variance in both metrics, indicating its performance is highly sensitive to its configuration or the specific task/data it's applied to.
5. **Peak Performance Zone:** The highest density of high-accuracy points (>48%) occurs within a CTC range of approximately 1.4 to 1.8 billion tokens.
### Interpretation
This chart visualizes the complex relationship between tokenization strategy, the resulting compressed representation of a text corpus (CTC), and the downstream task performance (Average Accuracy). It demonstrates that there is no single "best" tokenizer; the optimal choice depends on the desired balance between compression efficiency (lower CTC) and model accuracy.
The clustering suggests that methods like BPE and WordPiece offer predictable, high-performance outcomes within a specific operational range. SaGe provides a good balance, maintaining high accuracy even with a moderately higher token count. The stark split in Unigram's results is particularly noteworthy, implying that its performance is not robust and can fail dramatically under certain conditions. PathPiece's wide scatter positions it as a potentially high-risk, high-reward option, capable of both the worst and some of the best results, requiring careful tuning.
From a research perspective, this plot argues against evaluating tokenizers on a single metric. A comprehensive assessment must consider both the efficiency of the tokenization (CTC) and its impact on model quality (Accuracy). The outliers, like the low-accuracy Unigram cluster and the low-CTC/low-accuracy PathPiece points, are critical for understanding the failure modes of these algorithms.