TECHNICAL ASSET FINGERPRINT
6ec449c3a4cc58074b1d9a15
Click to view fullscreen
Press ESC or click to close
FOUND IN PAPERS
EXPERT: gemini-2.5-flash-free VERSION 1
RUNTIME: google-free/gemini-2.5-flash
INTEL_VERIFIED
## Chart Type: Line Chart - Mean Pass Rate vs. Mean Number of Tokens Generated for GPT Models
### Overview
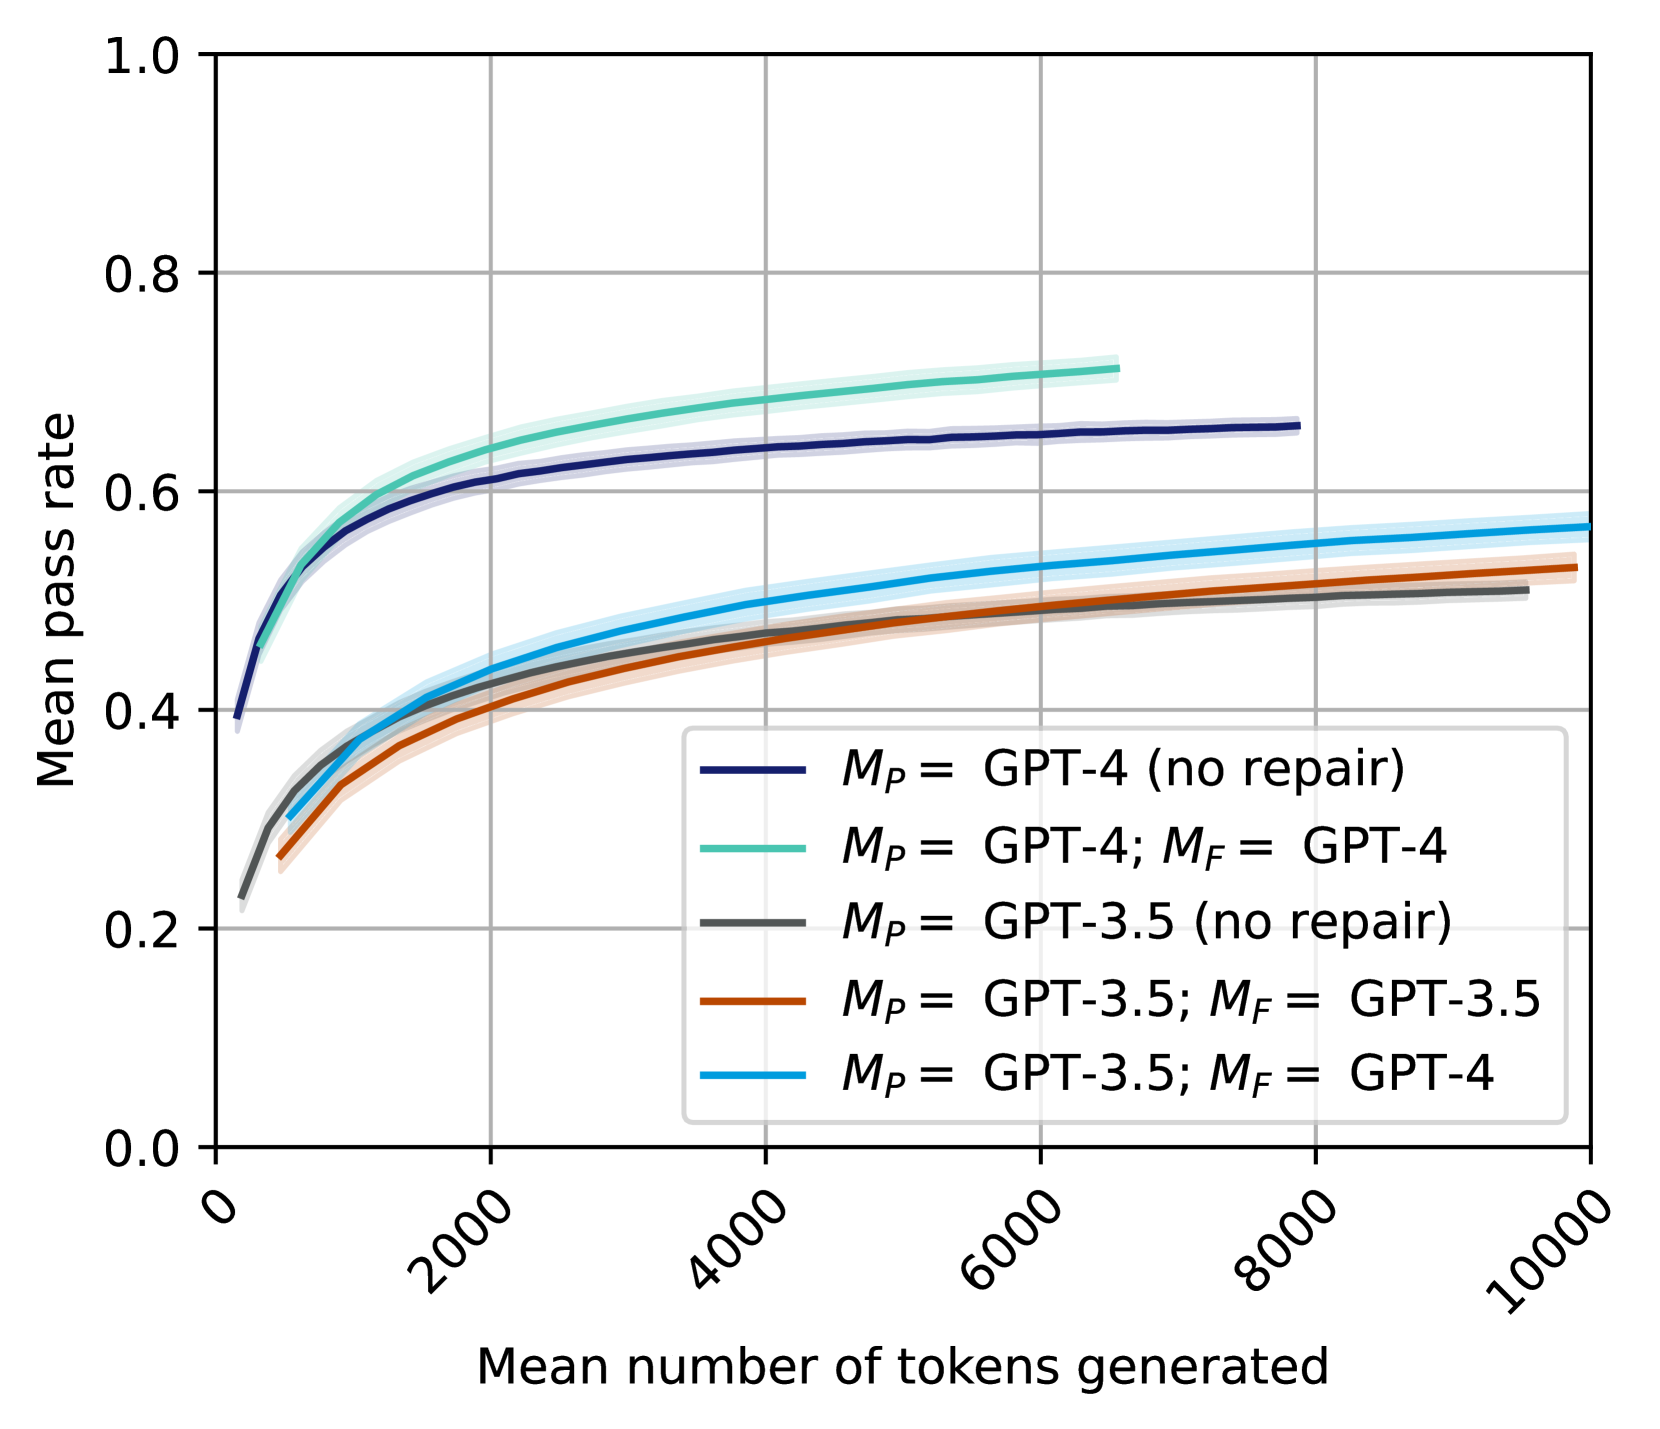
This image displays a line chart illustrating the relationship between the "Mean pass rate" (Y-axis) and the "Mean number of tokens generated" (X-axis) for five different configurations of GPT models. Each line represents a distinct model setup, differentiated by the primary model ($M_P$) and, if applicable, a repair model ($M_F$). Shaded areas around each line indicate uncertainty or a confidence interval.
### Components/Axes
The chart consists of a main plotting area, a Y-axis on the left, an X-axis at the bottom, and a legend in the bottom-right.
* **Y-axis Label**: "Mean pass rate"
* **Y-axis Range**: From 0.0 to 1.0.
* **Y-axis Major Ticks**: 0.0, 0.2, 0.4, 0.6, 0.8, 1.0.
* **X-axis Label**: "Mean number of tokens generated"
* **X-axis Range**: From 0 to 10000.
* **X-axis Major Ticks**: 0, 2000, 4000, 6000, 8000, 10000.
* **X-axis Tick Label Orientation**: Labels are rotated approximately 45 degrees counter-clockwise.
* **Grid**: Light gray grid lines are present, aligning with the major ticks on both axes.
* **Legend**: Located in the bottom-right quadrant of the plot area. It lists five data series with their corresponding line colors:
* **Dark Blue line**: $M_P$ = GPT-4 (no repair)
* **Teal/Light Green line**: $M_P$ = GPT-4; $M_F$ = GPT-4
* **Dark Gray line**: $M_P$ = GPT-3.5 (no repair)
* **Brown/Orange line**: $M_P$ = GPT-3.5; $M_F$ = GPT-3.5
* **Light Blue/Cyan line**: $M_P$ = GPT-3.5; $M_F$ = GPT-4
### Detailed Analysis
Each data series shows a general trend of an initial rapid increase in mean pass rate as the mean number of tokens generated increases, followed by a plateau where the pass rate stabilizes or increases very slowly. All lines are accompanied by a translucent shaded area, representing a confidence interval around the mean pass rate.
1. **Teal/Light Green line ($M_P$ = GPT-4; $M_F$ = GPT-4)**:
* **Trend**: This line starts at a relatively high pass rate, rises steeply, and then flattens out to become the highest performing series. It ends around 6500 tokens.
* **Approximate Data Points**:
* ~0 tokens: ~0.40 pass rate
* ~1000 tokens: ~0.60 pass rate
* ~2000 tokens: ~0.65 pass rate
* ~4000 tokens: ~0.68 pass rate
* ~6000 tokens: ~0.70 pass rate (line ends)
2. **Dark Blue line ($M_P$ = GPT-4 (no repair))**:
* **Trend**: This line follows a similar pattern to the Teal line, starting high, rising steeply, and then flattening. It consistently performs lower than the Teal line but higher than all GPT-3.5 configurations. It ends around 7800 tokens.
* **Approximate Data Points**:
* ~0 tokens: ~0.40 pass rate
* ~1000 tokens: ~0.58 pass rate
* ~2000 tokens: ~0.62 pass rate
* ~4000 tokens: ~0.64 pass rate
* ~6000 tokens: ~0.65 pass rate
* ~7800 tokens: ~0.66 pass rate (line ends)
3. **Light Blue/Cyan line ($M_P$ = GPT-3.5; $M_F$ = GPT-4)**:
* **Trend**: This line starts at a lower pass rate than the GPT-4 primary models, rises, and then flattens. It is the highest performing among the GPT-3.5 primary model configurations. It extends to 10000 tokens.
* **Approximate Data Points**:
* ~0 tokens: ~0.25 pass rate
* ~1000 tokens: ~0.40 pass rate
* ~2000 tokens: ~0.45 pass rate
* ~4000 tokens: ~0.50 pass rate
* ~6000 tokens: ~0.53 pass rate
* ~8000 tokens: ~0.55 pass rate
* ~10000 tokens: ~0.56 pass rate
4. **Brown/Orange line ($M_P$ = GPT-3.5; $M_F$ = GPT-3.5)**:
* **Trend**: This line shows a similar initial rise and plateau, consistently performing slightly below the Light Blue/Cyan line. It extends to 10000 tokens.
* **Approximate Data Points**:
* ~0 tokens: ~0.25 pass rate
* ~1000 tokens: ~0.38 pass rate
* ~2000 tokens: ~0.42 pass rate
* ~4000 tokens: ~0.46 pass rate
* ~6000 tokens: ~0.49 pass rate
* ~8000 tokens: ~0.51 pass rate
* ~10000 tokens: ~0.52 pass rate
5. **Dark Gray line ($M_P$ = GPT-3.5 (no repair))**:
* **Trend**: This line exhibits the lowest pass rates across all token counts, following the general trend of rising and then flattening. It extends to 10000 tokens.
* **Approximate Data Points**:
* ~0 tokens: ~0.25 pass rate
* ~1000 tokens: ~0.35 pass rate
* ~2000 tokens: ~0.40 pass rate
* ~4000 tokens: ~0.43 pass rate
* ~6000 tokens: ~0.46 pass rate
* ~8000 tokens: ~0.48 pass rate
* ~10000 tokens: ~0.49 pass rate
### Key Observations
* **Performance Hierarchy**: The models using GPT-4 as the primary model ($M_P$) consistently achieve higher pass rates than those using GPT-3.5 as $M_P$.
* **Impact of Repair Mechanism ($M_F$)**: For both GPT-4 and GPT-3.5 primary models, the presence of a repair mechanism ($M_F$) improves the mean pass rate compared to the "no repair" configuration.
* **GPT-4 as Repair Model**: Using GPT-4 as the repair model ($M_F$ = GPT-4) yields the highest pass rates, even when the primary model is GPT-3.5 (Light Blue/Cyan line vs. Brown/Orange line). The configuration $M_P$ = GPT-3.5; $M_F$ = GPT-4 significantly outperforms $M_P$ = GPT-3.5; $M_F$ = GPT-3.5.
* **Highest Performance**: The combination of $M_P$ = GPT-4 and $M_F$ = GPT-4 (Teal line) achieves the highest mean pass rate, reaching approximately 0.70.
* **Lowest Performance**: The configuration $M_P$ = GPT-3.5 (no repair) (Dark Gray line) shows the lowest mean pass rate, plateauing around 0.49.
* **Diminishing Returns**: All lines show that the most significant gains in pass rate occur within the first ~2000-4000 tokens generated. Beyond this point, the pass rate continues to increase but at a much slower rate, suggesting diminishing returns for generating more tokens.
* **Confidence Intervals**: The shaded areas around each line indicate variability or uncertainty in the mean pass rate, which appears to be relatively consistent across the range of tokens for each configuration.
### Interpretation
This chart demonstrates the effectiveness of different large language model (LLM) configurations in achieving a higher "pass rate" on an unspecified task, likely related to code generation, problem-solving, or complex reasoning, where "tokens generated" might refer to the length or complexity of the model's output.
The data strongly suggests that:
1. **Model Capability Matters**: GPT-4 is a significantly more capable model than GPT-3.5 for this task, as evidenced by the higher pass rates when GPT-4 is used as the primary model ($M_P$).
2. **Repair Mechanisms are Beneficial**: Implementing a "repair" mechanism ($M_F$) consistently improves performance. This implies that an iterative refinement or error correction step can enhance the quality of the generated output.
3. **Quality of Repair Model is Crucial**: The choice of the repair model is critical. Using a more powerful model like GPT-4 for repair ($M_F$ = GPT-4) provides a substantial boost in pass rate, even if the initial generation ($M_P$) is done by a less capable model like GPT-3.5. This highlights a potential strategy: leverage a powerful model for refinement even if the primary generation is resource-constrained.
4. **Efficiency Considerations**: While generating more tokens generally leads to a higher pass rate, the plateauing effect indicates that there's an optimal range for token generation. Beyond approximately 4000-6000 tokens, the additional computational cost of generating more tokens yields only marginal improvements in the pass rate, suggesting a point of diminishing returns. This is important for optimizing resource usage and latency.
In essence, the chart illustrates that both the inherent capability of the primary model and the strategic application of a repair mechanism (especially one powered by a more advanced model) are key factors in maximizing the success rate of LLM-generated outputs, with an important consideration for the efficiency of token generation.
DECODING INTELLIGENCE...