## Line Graph: Efficiency vs. Node Size Comparison
### Overview
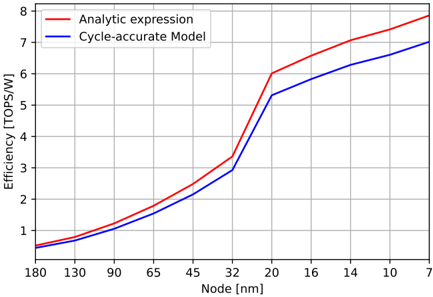
The image is a line graph comparing the efficiency (in TOPS/W) of two computational models—Analytic expression and Cycle-accurate Model—as a function of transistor node size (in nanometers). The graph illustrates how efficiency trends diverge between the two models as node size decreases.
### Components/Axes
- **X-axis (Node [nm])**: Ranges from 180 nm to 7 nm, with labeled intervals at 180, 130, 90, 65, 45, 32, 20, 16, 14, 10, and 7 nm.
- **Y-axis (Efficiency [TOPS/W])**: Ranges from 0 to 8 TOPS/W, with increments of 1.
- **Legend**: Located in the top-left corner, with:
- **Red line**: Analytic expression
- **Blue line**: Cycle-accurate Model
### Detailed Analysis
1. **Analytic Expression (Red Line)**:
- Starts at ~0.5 TOPS/W at 180 nm.
- Shows a steep upward trend, reaching ~7.8 TOPS/W at 7 nm.
- Key data points:
- 130 nm: ~0.8 TOPS/W
- 90 nm: ~1.2 TOPS/W
- 65 nm: ~1.8 TOPS/W
- 45 nm: ~2.5 TOPS/W
- 32 nm: ~3.3 TOPS/W
- 20 nm: ~6.0 TOPS/W
- 16 nm: ~6.6 TOPS/W
- 14 nm: ~7.0 TOPS/W
- 10 nm: ~7.3 TOPS/W
- 7 nm: ~7.8 TOPS/W
2. **Cycle-accurate Model (Blue Line)**:
- Starts slightly below the Analytic line at 180 nm (~0.4 TOPS/W).
- Follows a similar upward trend but with a less steep slope.
- Key data points:
- 130 nm: ~0.7 TOPS/W
- 90 nm: ~1.0 TOPS/W
- 65 nm: ~1.5 TOPS/W
- 45 nm: ~2.1 TOPS/W
- 32 nm: ~2.9 TOPS/W
- 20 nm: ~5.3 TOPS/W
- 16 nm: ~5.8 TOPS/W
- 14 nm: ~6.2 TOPS/W
- 10 nm: ~6.5 TOPS/W
- 7 nm: ~7.0 TOPS/W
### Key Observations
- The Analytic expression consistently outperforms the Cycle-accurate Model across all node sizes, with the gap widening as node size decreases.
- Both models show exponential growth in efficiency as node size shrinks, but the Analytic model’s predictions are ~10–20% higher than the Cycle-accurate Model at smaller nodes (e.g., 7 nm).
- The Cycle-accurate Model’s efficiency plateaus slightly less sharply than the Analytic model, suggesting it accounts for real-world constraints.
### Interpretation
The data suggests that the Analytic expression provides optimistic efficiency estimates, likely due to idealized assumptions (e.g., ignoring leakage, variability, or overhead). In contrast, the Cycle-accurate Model incorporates practical limitations, resulting in more conservative but realistic predictions. The divergence between the two models highlights the trade-off between theoretical simplicity and real-world accuracy in computational design. For applications requiring precise performance metrics at advanced node sizes (e.g., 7 nm), the Cycle-accurate Model may be more reliable, while the Analytic expression could serve as a benchmark for theoretical exploration.