## Violin Plot: Absolute Error Distributions for Law School Admissions and Adult Census Income
### Overview
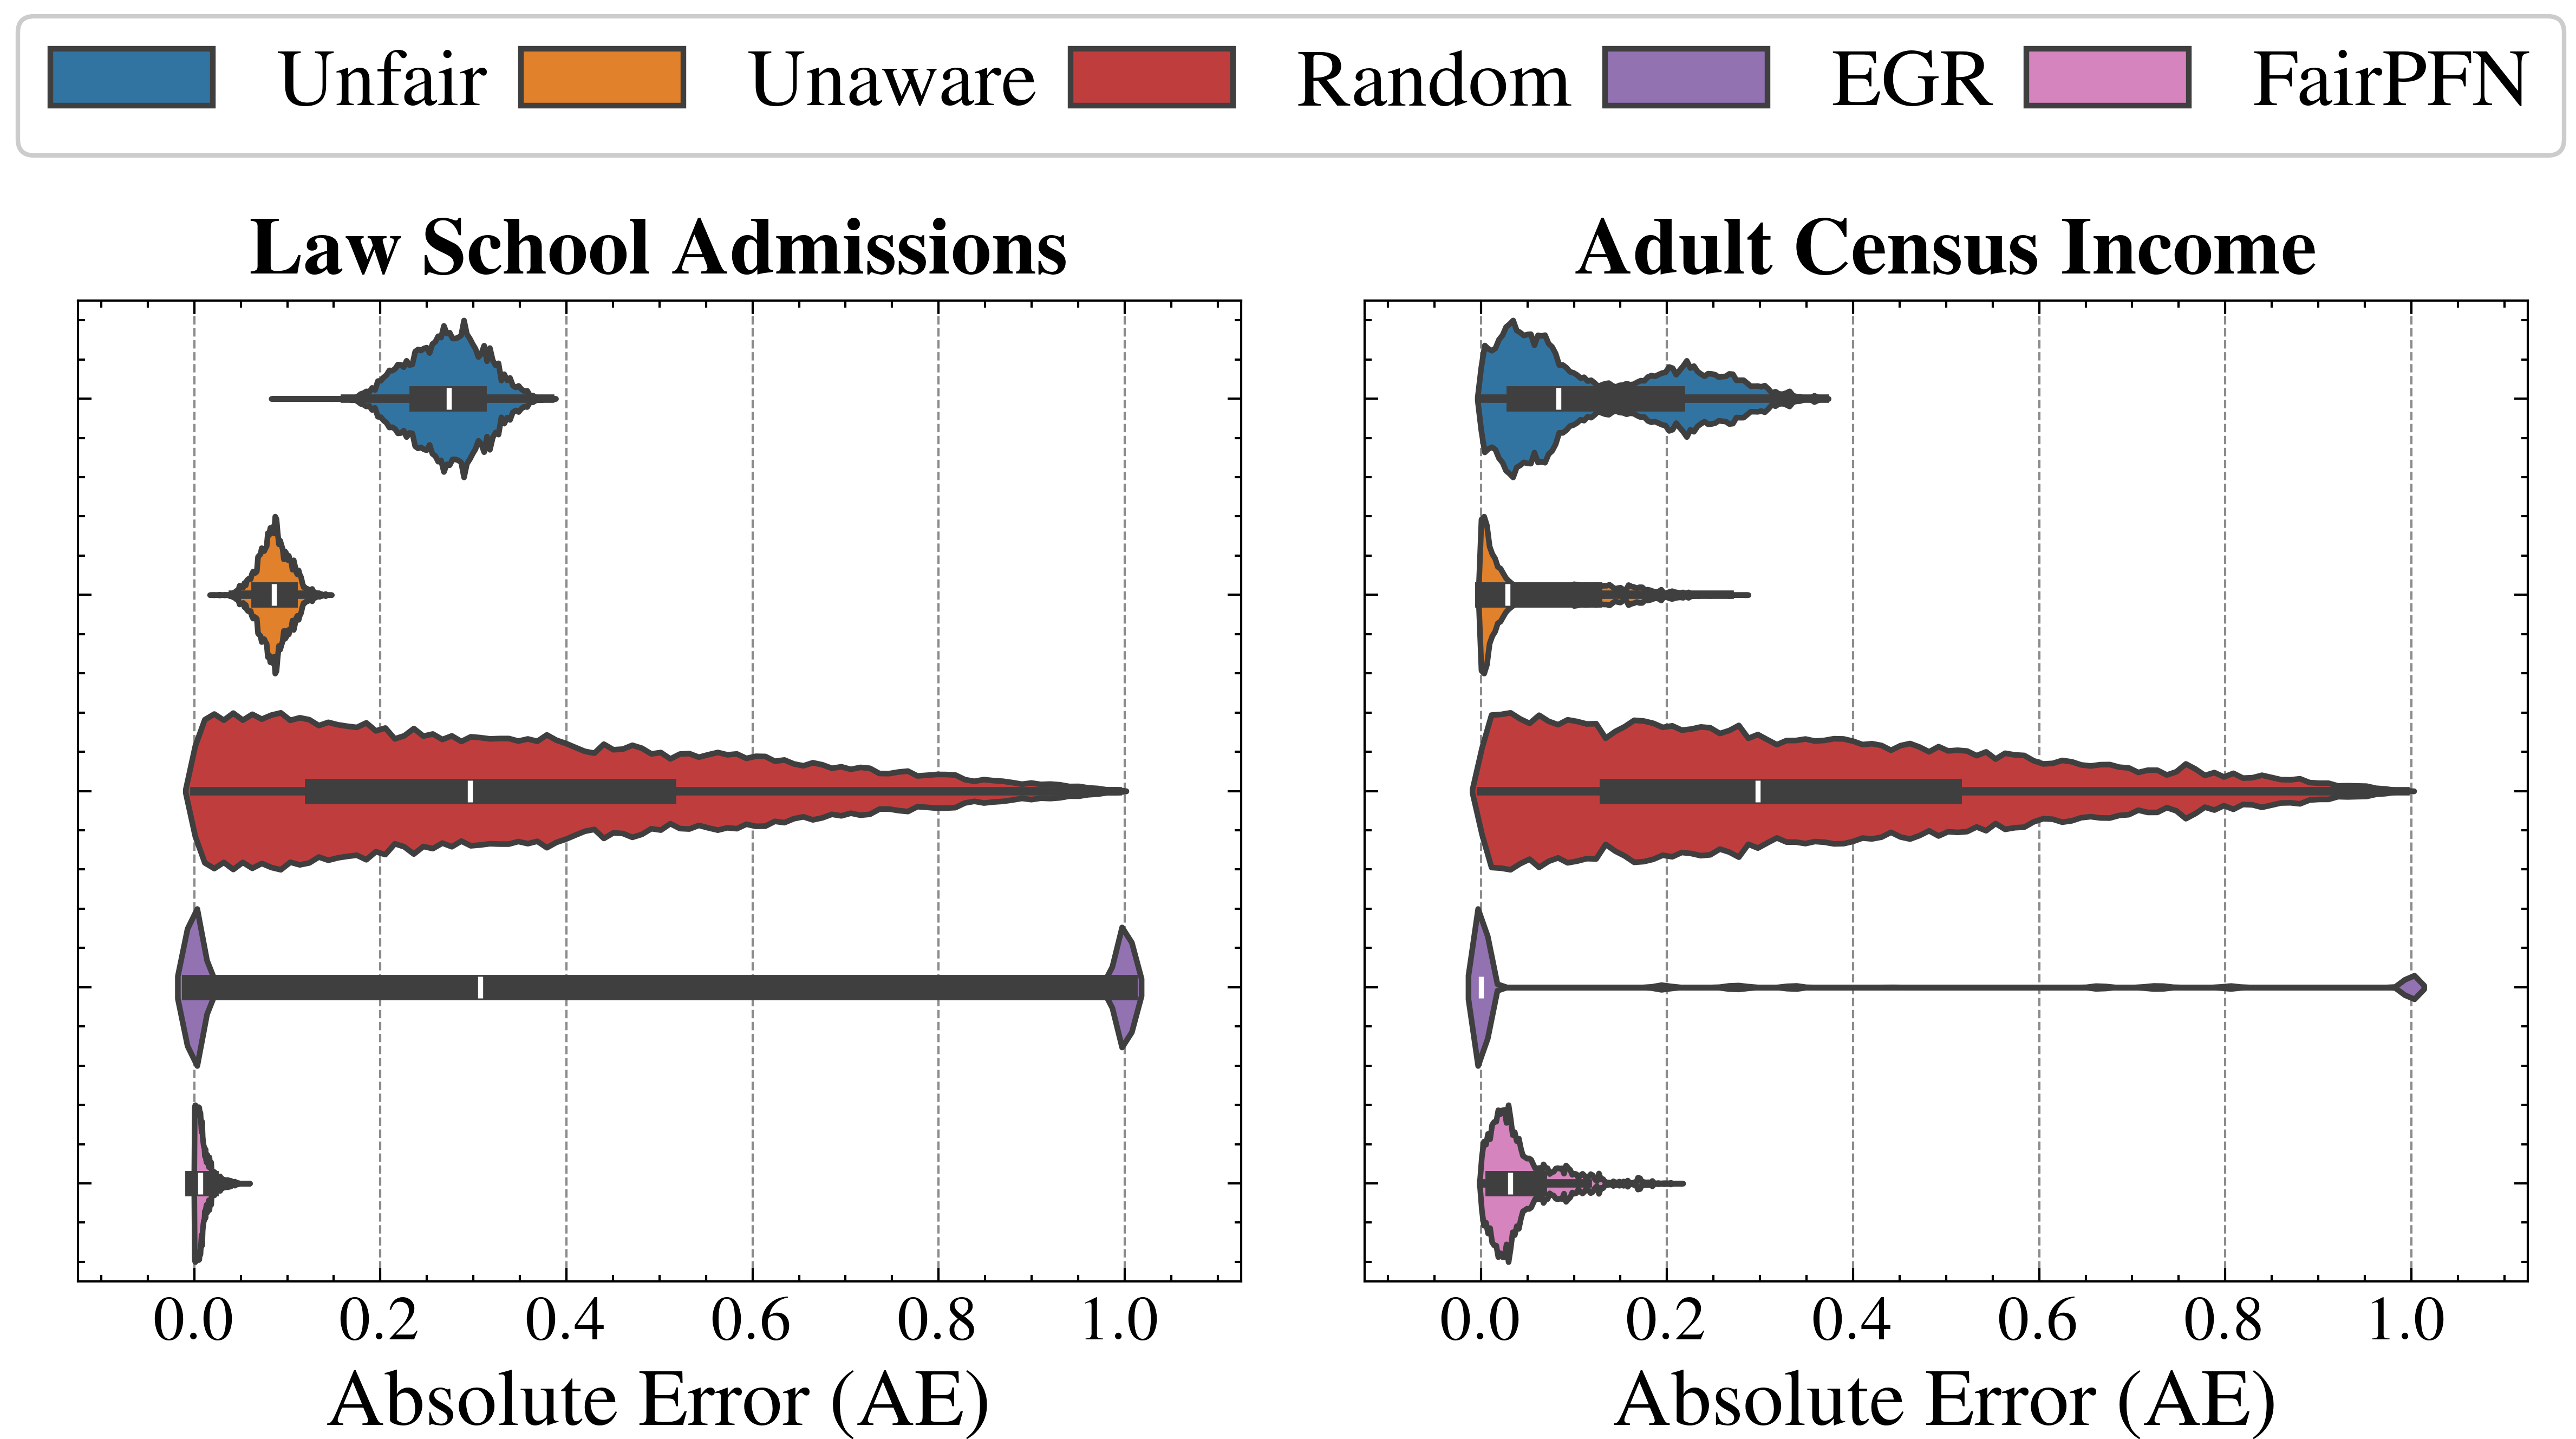
The image presents two violin plots side-by-side, comparing the distribution of Absolute Error (AE) for different prediction methods applied to "Law School Admissions" (left) and "Adult Census Income" (right) datasets. The methods are "Unfair", "Unaware", "Random", "EGR", and "FairPFN". The x-axis represents the Absolute Error (AE), ranging from 0.0 to 1.0. The y-axis implicitly represents the density of data points for each method at a given AE value.
### Components/Axes
* **Titles:** "Law School Admissions" (left plot), "Adult Census Income" (right plot)
* **X-Axis:** "Absolute Error (AE)" with scale from 0.0 to 1.0 in increments of 0.2.
* **Y-Axis:** Implicitly represents the density of data points.
* **Legend (Top):**
* Blue: "Unfair"
* Orange: "Unaware"
* Red: "Random"
* Purple: "EGR"
* Pink: "FairPFN"
### Detailed Analysis
#### Law School Admissions (Left Plot)
* **Unfair (Blue):** The distribution is centered around AE = 0.2, with a narrow spread.
* **Unaware (Orange):** The distribution is centered around AE = 0.1, with a narrow spread.
* **Random (Red):** The distribution is broad, extending from AE = 0.0 to AE = 1.0, with a peak around AE = 0.2.
* **EGR (Purple):** The distribution is concentrated between AE = 0.0 and AE = 1.0, with a rectangular shape.
* **FairPFN (Pink):** The distribution is not present in this plot.
#### Adult Census Income (Right Plot)
* **Unfair (Blue):** The distribution is centered around AE = 0.1, with a narrow spread.
* **Unaware (Orange):** The distribution is centered around AE = 0.1, with a narrow spread.
* **Random (Red):** The distribution is broad, extending from AE = 0.0 to AE = 1.0, with a peak around AE = 0.2.
* **EGR (Purple):** The distribution is concentrated at AE = 1.0.
* **FairPFN (Pink):** The distribution is centered around AE = 0.1, with a narrow spread.
### Key Observations
* The "Random" method consistently exhibits the broadest distribution of Absolute Errors in both datasets.
* The "Unfair" and "Unaware" methods have similar distributions in both datasets, with relatively low Absolute Errors.
* The "EGR" method shows different behavior across the two datasets, with a broad distribution in "Law School Admissions" and a concentration at AE = 1.0 in "Adult Census Income".
* The "FairPFN" method is only present in the "Adult Census Income" dataset, showing a low Absolute Error distribution.
### Interpretation
The violin plots visualize the performance of different prediction methods in terms of Absolute Error. The "Random" method's broad distribution suggests it is the least reliable, producing a wide range of errors. The "Unfair" and "Unaware" methods appear to be more accurate, consistently yielding lower Absolute Errors. The "EGR" method's performance varies significantly between the two datasets, indicating its sensitivity to the specific data characteristics. The "FairPFN" method, present only in the "Adult Census Income" dataset, also demonstrates relatively low Absolute Errors, suggesting it is a potentially effective method for this dataset. The plots highlight the importance of choosing an appropriate prediction method based on the specific dataset and desired level of accuracy.