## Line Graph: LM Loss vs. PFlOP/s-days Projections
### Overview
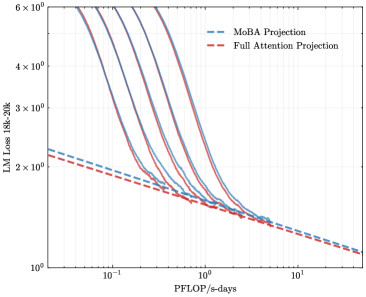
The image is a line graph comparing two computational efficiency projections: "MoBA Projection" (blue dashed line) and "Full Attention Projection" (red dashed line). Both lines depict the relationship between computational throughput (PFlOP/s-days) and language model loss (LM Loss 18k-20k) on a logarithmic scale. The graph shows how loss decreases as computational power increases, with both projections converging at higher PFlOP values.
### Components/Axes
- **X-axis (PFlOP/s-days)**: Logarithmic scale ranging from 10⁻¹ to 10¹. Labeled "PFlOP/s-days" with gridlines at 10⁻¹, 10⁰, and 10¹.
- **Y-axis (LM Loss 18k-20k)**: Logarithmic scale ranging from 10⁰ to 6×10⁰. Labeled "LM Loss 18k-20k" with gridlines at 10⁰, 2×10⁰, 3×10⁰, 4×10⁰, 5×10⁰, and 6×10⁰.
- **Legend**: Located in the top-right corner, associating blue dashed lines with "MoBA Projection" and red dashed lines with "Full Attention Projection."
### Detailed Analysis
1. **MoBA Projection (Blue Dashed Line)**:
- Starts at approximately 2.5×10⁰ LM Loss at 10⁻¹ PFlOP/s-days.
- Declines steeply, reaching ~1.2×10⁰ LM Loss at 10⁰ PFlOP/s-days.
- Continues to decrease gradually, ending near ~1.0×10⁰ LM Loss at 10¹ PFlOP/s-days.
2. **Full Attention Projection (Red Dashed Line)**:
- Begins slightly lower than MoBA at ~2.2×10⁰ LM Loss at 10⁻¹ PFlOP/s-days.
- Follows a similar downward trend but with a less steep initial decline.
- Converges with the MoBA line near 10¹ PFlOP/s-days, ending at ~1.0×10⁰ LM Loss.
3. **Trends**:
- Both lines exhibit exponential decay on the log-log scale, indicating power-law relationships.
- MoBA Projection shows a steeper initial improvement in efficiency (higher slope) compared to Full Attention Projection.
- Convergence at high PFlOP values suggests diminishing returns for both approaches beyond ~10⁰ PFlOP/s-days.
### Key Observations
- **Initial Efficiency Gap**: MoBA Projection achieves lower LM Loss than Full Attention Projection at low PFlOP values (10⁻¹ to 10⁰).
- **Convergence Point**: Both projections align closely at 10¹ PFlOP/s-days, implying similar performance at extreme computational scales.
- **Log-Log Scale Implications**: The straight-line segments on the log-log plot suggest polynomial relationships between PFlOP and LM Loss.
### Interpretation
The graph demonstrates that MoBA Projection offers superior initial efficiency gains for language model training, reducing LM Loss more rapidly than Full Attention Projection at lower computational scales. However, both approaches achieve comparable performance at the highest PFlOP values (10¹), suggesting that Full Attention Projection may become more viable or cost-effective at extreme computational budgets. The convergence implies that architectural differences (MoBA vs. Full Attention) have diminishing impact as computational resources scale, potentially pointing to shared bottlenecks in large-scale model training. This could inform hardware-software co-design strategies for optimizing AI infrastructure.