## Line Chart: Accuracy vs. Sample Size
### Overview
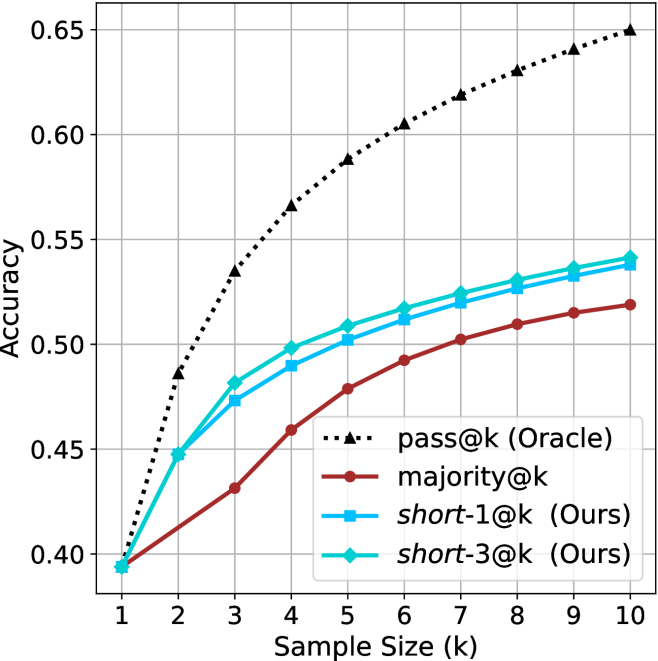
The image is a line chart comparing the accuracy of four different methods ("pass@k (Oracle)", "majority@k", "short-1@k (Ours)", and "short-3@k (Ours)") as a function of sample size (k). The x-axis represents the sample size, ranging from 1 to 10. The y-axis represents accuracy, ranging from 0.40 to 0.65.
### Components/Axes
* **X-axis:** Sample Size (k), with tick marks at each integer value from 1 to 10.
* **Y-axis:** Accuracy, with tick marks at 0.40, 0.45, 0.50, 0.55, 0.60, and 0.65.
* **Legend:** Located in the bottom-right corner, it identifies each line by color and label:
* Black dotted line with triangles: pass@k (Oracle)
* Brown line with circles: majority@k
* Blue line with squares: short-1@k (Ours)
* Cyan line with diamonds: short-3@k (Ours)
### Detailed Analysis
* **pass@k (Oracle):** (Black dotted line with triangles) Starts at approximately 0.39 at k=1 and increases rapidly to approximately 0.49 at k=2, 0.53 at k=3, 0.57 at k=4, 0.60 at k=5, 0.61 at k=6, 0.62 at k=7, 0.63 at k=8, 0.64 at k=9, and 0.65 at k=10. The trend is upward, with the most significant increase in accuracy occurring between k=1 and k=5.
* **majority@k:** (Brown line with circles) Starts at approximately 0.39 at k=1 and increases steadily to approximately 0.43 at k=2, 0.45 at k=3, 0.47 at k=4, 0.49 at k=5, 0.50 at k=6, 0.51 at k=7, 0.52 at k=8, 0.52 at k=9, and 0.52 at k=10. The trend is upward, but the rate of increase slows down as k increases.
* **short-1@k (Ours):** (Blue line with squares) Starts at approximately 0.39 at k=1 and increases to approximately 0.45 at k=2, 0.48 at k=3, 0.49 at k=4, 0.51 at k=5, 0.52 at k=6, 0.53 at k=7, 0.53 at k=8, 0.54 at k=9, and 0.54 at k=10. The trend is upward, with a decreasing rate of increase as k increases.
* **short-3@k (Ours):** (Cyan line with diamonds) Starts at approximately 0.39 at k=1 and increases to approximately 0.45 at k=2, 0.48 at k=3, 0.49 at k=4, 0.51 at k=5, 0.51 at k=6, 0.52 at k=7, 0.53 at k=8, 0.53 at k=9, and 0.54 at k=10. The trend is upward, with a decreasing rate of increase as k increases.
### Key Observations
* The "pass@k (Oracle)" method consistently outperforms the other three methods across all sample sizes.
* The "majority@k" method has the lowest accuracy among the four methods.
* The "short-1@k (Ours)" and "short-3@k (Ours)" methods perform similarly, with "short-3@k (Ours)" slightly better.
* All methods show diminishing returns in accuracy as the sample size increases beyond k=5.
### Interpretation
The chart demonstrates the relationship between sample size and accuracy for different methods. The "pass@k (Oracle)" method serves as an upper bound or ideal performance, while the other methods ("majority@k", "short-1@k (Ours)", and "short-3@k (Ours)") show varying degrees of improvement with increasing sample size. The fact that the "pass@k (Oracle)" method has significantly higher accuracy suggests that there is room for improvement in the other methods. The diminishing returns observed for all methods indicate that increasing the sample size beyond a certain point may not be the most efficient way to improve accuracy. The "short-1@k (Ours)" and "short-3@k (Ours)" methods, being developed by the authors ("Ours"), are likely the focus of the study, and their performance is being compared to the baseline "majority@k" and the ideal "pass@k (Oracle)".