## Line Chart: Accuracy vs. Sample Size (k)
### Overview
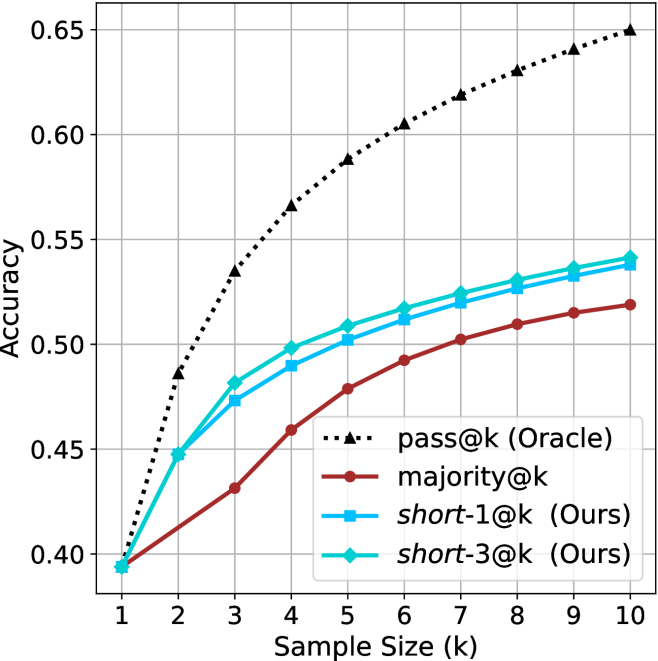
This chart illustrates the performance (Accuracy) of four different evaluation methods across varying sample sizes ($k$), ranging from 1 to 10. The chart compares a theoretical "Oracle" baseline against a standard "majority" voting method and two proposed methods labeled "Ours" (`short-1@k` and `short-3@k`).
### Components/Axes
* **X-Axis:** Labeled "Sample Size (k)". The scale is linear, ranging from 1 to 10 in integer increments.
* **Y-Axis:** Labeled "Accuracy". The scale ranges from 0.40 to 0.65, with grid lines at 0.05 intervals.
* **Legend:** Located in the bottom-right quadrant of the chart area.
* **pass@k (Oracle):** Black dotted line with triangle markers.
* **majority@k:** Dark red solid line with circle markers.
* **short-1@k (Ours):** Medium blue solid line with square markers.
* **short-3@k (Ours):** Cyan (light blue) solid line with diamond markers.
### Detailed Analysis
All four data series exhibit a positive correlation between sample size ($k$) and accuracy, showing a steep initial increase that gradually flattens as $k$ increases (diminishing returns).
**Data Point Estimates (Approximate):**
| Sample Size (k) | pass@k (Oracle) | short-3@k (Ours) | short-1@k (Ours) | majority@k |
| :--- | :--- | :--- | :--- | :--- |
| **1** | ~0.395 | ~0.395 | ~0.395 | ~0.395 |
| **2** | ~0.485 | ~0.448 | ~0.448 | ~0.415 |
| **3** | ~0.535 | ~0.482 | ~0.475 | ~0.432 |
| **4** | ~0.565 | ~0.498 | ~0.490 | ~0.460 |
| **5** | ~0.590 | ~0.510 | ~0.502 | ~0.480 |
| **6** | ~0.605 | ~0.518 | ~0.512 | ~0.492 |
| **7** | ~0.620 | ~0.525 | ~0.520 | ~0.502 |
| **8** | ~0.630 | ~0.532 | ~0.528 | ~0.510 |
| **9** | ~0.640 | ~0.538 | ~0.534 | ~0.515 |
| **10** | ~0.650 | ~0.542 | ~0.538 | ~0.520 |
*Note: At $k=1$, all methods converge at approximately 0.395 accuracy.*
### Key Observations
* **Performance Hierarchy:** The `pass@k (Oracle)` method is the clear upper bound, significantly outperforming all other methods across the entire range.
* **Proposed Method Efficacy:** Both "Ours" methods (`short-3@k` and `short-1@k`) consistently outperform the `majority@k` baseline.
* **Internal Comparison:** `short-3@k` (cyan/diamond) consistently maintains a higher accuracy than `short-1@k` (blue/square), though the gap between them narrows slightly as $k$ increases.
* **Diminishing Returns:** The slope of all lines is steepest between $k=1$ and $k=3$. Beyond $k=5$, the rate of accuracy gain per unit of $k$ decreases significantly for all methods.
### Interpretation
This chart is characteristic of machine learning benchmarks, specifically in code generation tasks (e.g., HumanEval), where `pass@k` is a standard metric.
* **The Oracle:** The `pass@k (Oracle)` represents the theoretical maximum accuracy achievable if the system were able to perfectly identify the correct solution among $k$ samples. Its dominance suggests that the other methods are limited by their selection or filtering strategies.
* **The "Ours" Methods:** The fact that `short-3@k` and `short-1@k` outperform `majority@k` suggests that the authors have developed a more effective filtering or ranking mechanism than simple majority voting. The "short" naming convention likely implies a strategy that prioritizes shorter code snippets or a specific subset of the generated samples.
* **Strategic Implications:** The widening gap between the Oracle and the other methods as $k$ increases indicates that while increasing the sample size helps, the selection strategies (`majority`, `short-1`, `short-3`) are not scaling as efficiently as the Oracle. This suggests there is still significant "room for improvement" in how the best solution is selected from a larger pool of candidates.