## Line Chart: LongBench Accuracy vs KV Cache Size (MultiNews Dataset)
### Overview
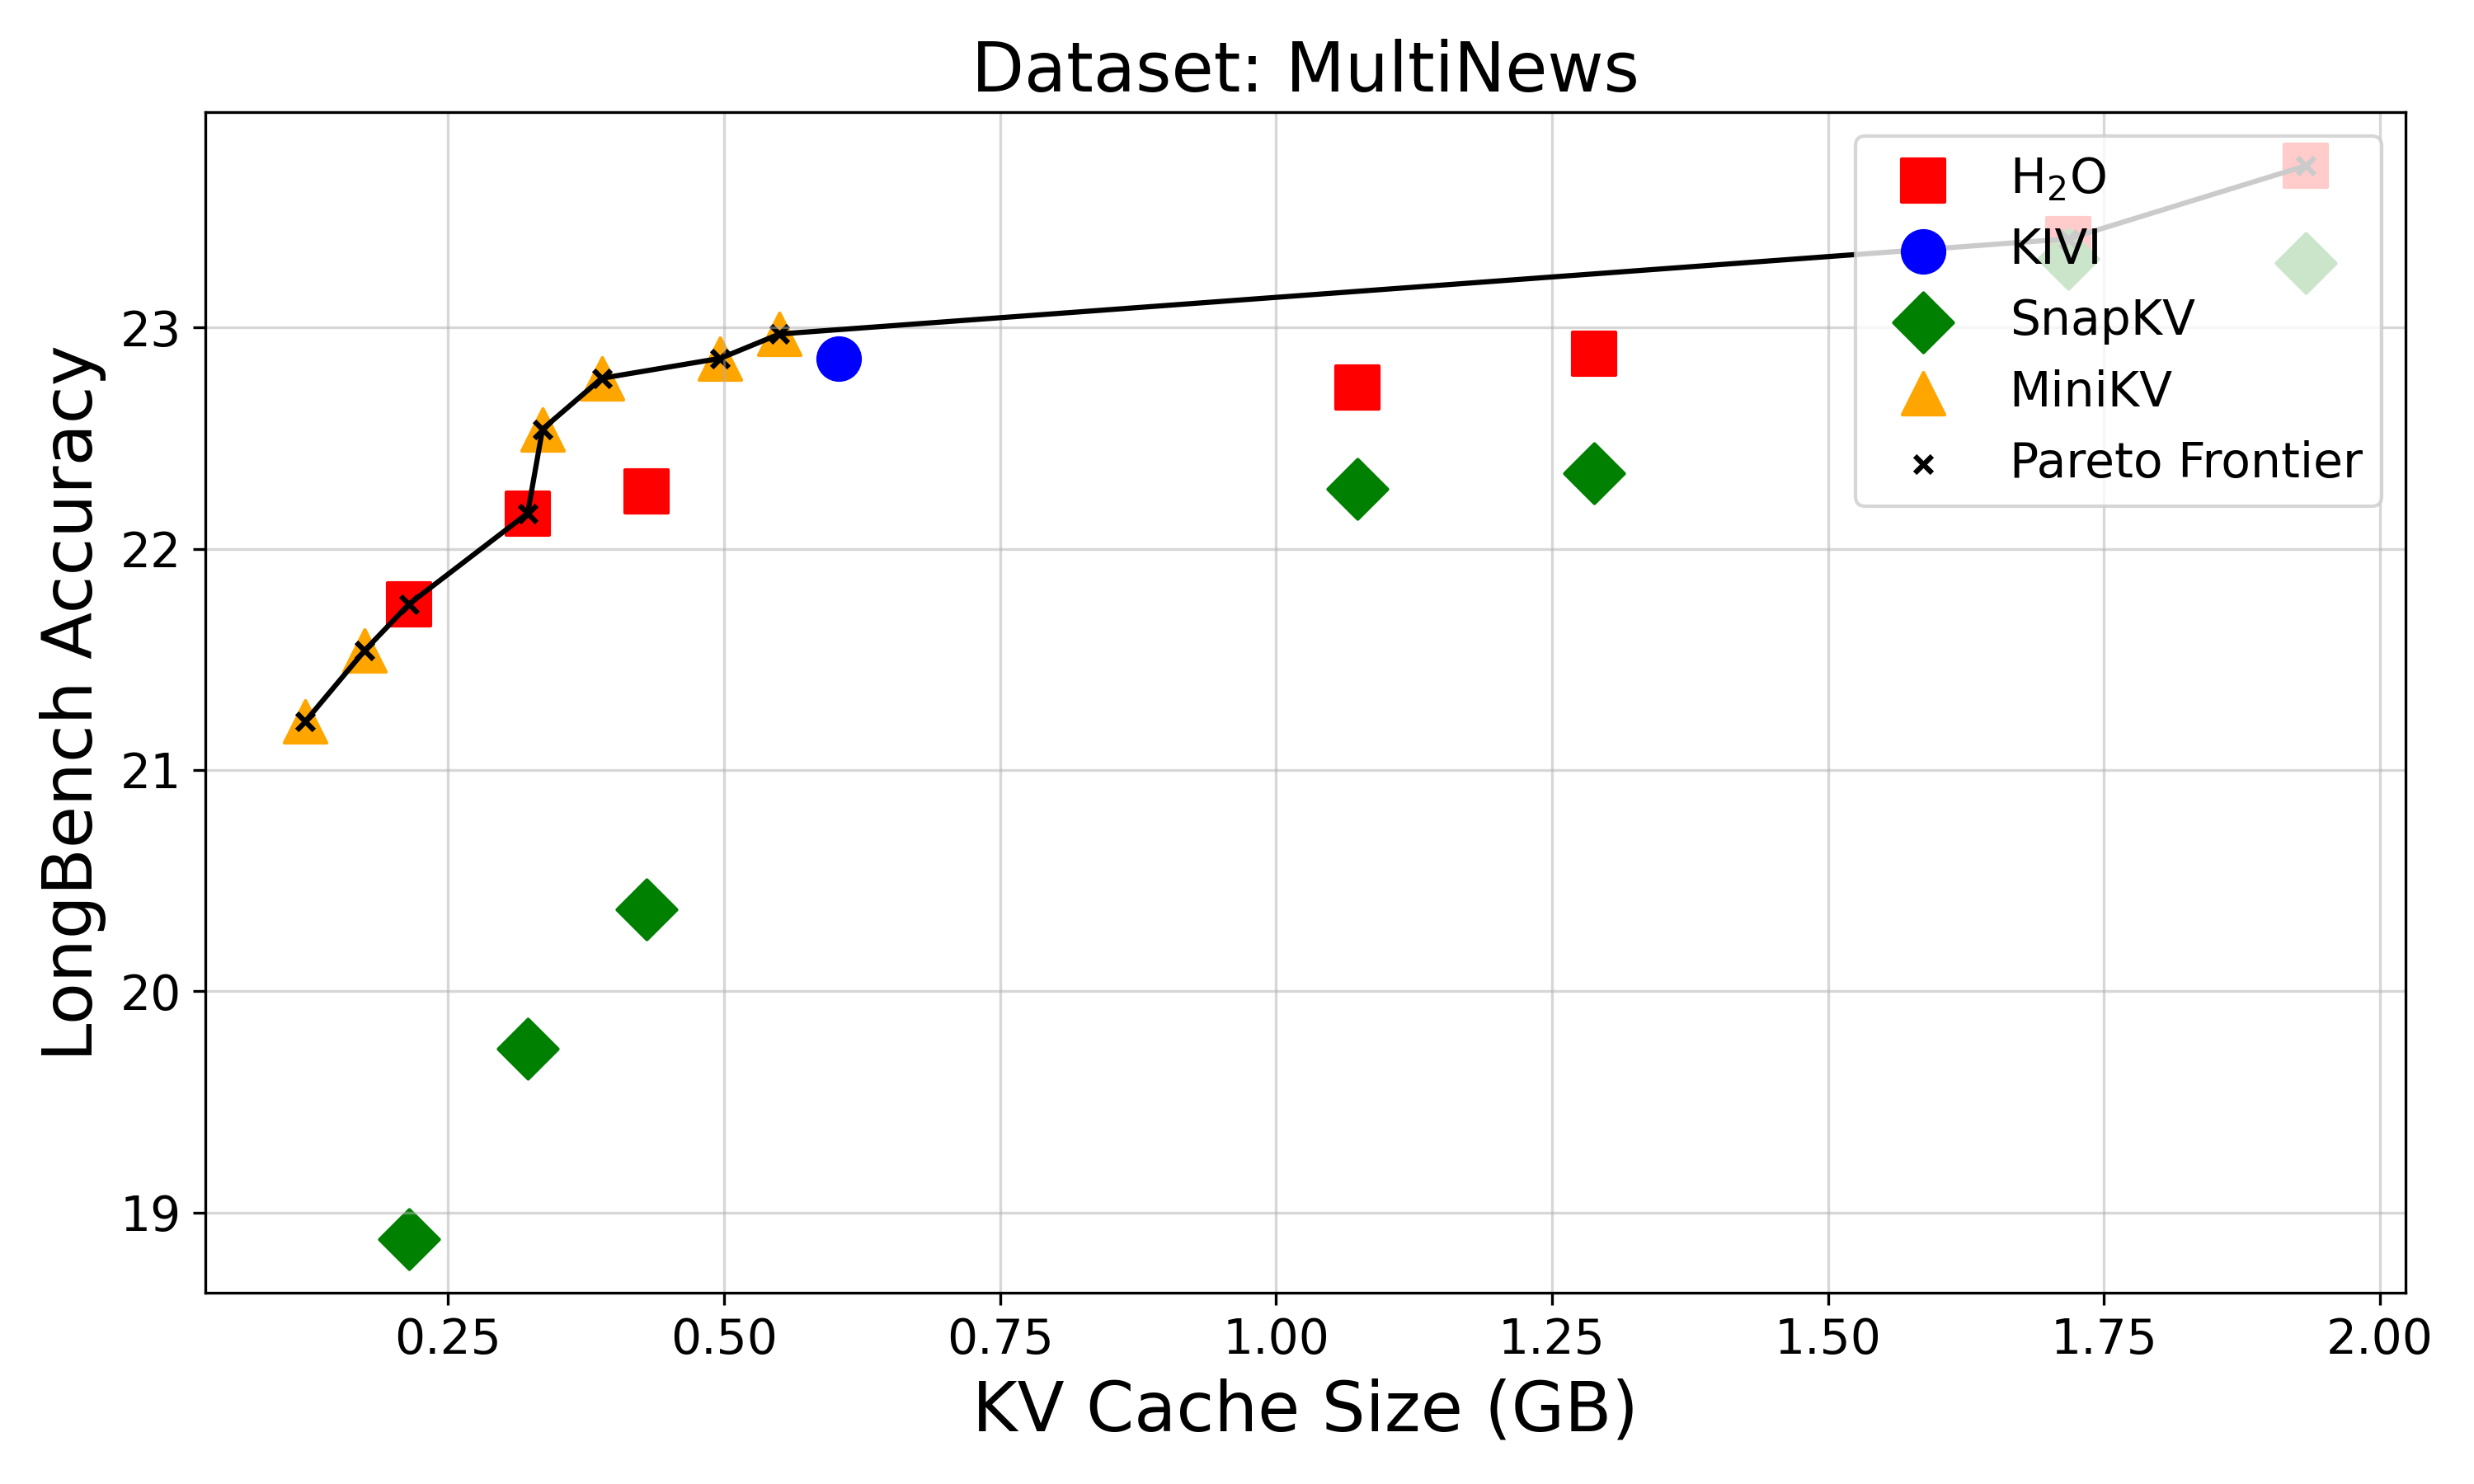
The chart visualizes the relationship between KV Cache Size (in GB) and LongBench Accuracy for five different systems (H2O, KIVI, SnapKV, MiniKV) and a Pareto Frontier reference line. The Pareto Frontier represents the optimal trade-off between cache size and accuracy.
### Components/Axes
- **X-axis**: KV Cache Size (GB)
- Scale: 0.25 to 2.00 GB
- Labels: 0.25, 0.5, 0.75, 1.0, 1.25, 1.5, 1.75, 2.0
- **Y-axis**: LongBench Accuracy
- Scale: 19 to 23.5
- Labels: 19, 20, 21, 22, 23, 23.5
- **Legend**:
- **H2O**: Red squares
- **KIVI**: Blue circle
- **SnapKV**: Green diamonds
- **MiniKV**: Yellow triangles
- **Pareto Frontier**: Black dashed line with crosses
### Detailed Analysis
1. **H2O (Red Squares)**
- Data points:
- (0.25 GB, 21.5)
- (0.5 GB, 22.2)
- (0.75 GB, 22.5)
- (1.0 GB, 22.8)
- (1.25 GB, 23.0)
- (1.5 GB, 23.2)
- (1.75 GB, 23.4)
- (2.0 GB, 23.6)
- Trend: Steady upward slope with diminishing returns.
2. **KIVI (Blue Circle)**
- Single data point:
- (0.6 GB, 22.8)
- Position: Near the Pareto Frontier at mid-range cache size.
3. **SnapKV (Green Diamonds)**
- Data points:
- (0.25 GB, 19.0)
- (0.5 GB, 20.4)
- (1.0 GB, 22.3)
- (1.25 GB, 22.4)
- (1.75 GB, 23.1)
- (2.0 GB, 23.3)
- Trend: Sharp improvement at 1.0 GB, plateauing afterward.
4. **MiniKV (Yellow Triangles)**
- Data points:
- (0.25 GB, 21.2)
- (0.5 GB, 21.6)
- (0.75 GB, 22.0)
- (1.0 GB, 22.5)
- Trend: Consistent gains up to 1.0 GB, then no further data.
5. **Pareto Frontier (Black Dashed Line)**
- Connects points:
- (0.25 GB, 21.5)
- (0.5 GB, 22.2)
- (0.75 GB, 22.5)
- (1.0 GB, 22.8)
- (1.25 GB, 23.0)
- (1.5 GB, 23.2)
- (1.75 GB, 23.4)
- (2.0 GB, 23.6)
- Trend: Smooth upward curve representing the theoretical optimal trade-off.
### Key Observations
- **Pareto Frontier Dominance**: All systems lie below or on the Pareto Frontier, indicating no system achieves both higher accuracy and lower cache usage simultaneously.
- **H2O and MiniKV**: Outperform others at lower cache sizes (0.25–1.0 GB).
- **SnapKV**: Lags initially but catches up at 1.75–2.0 GB.
- **KIVI**: Only one data point at 0.6 GB, suggesting limited testing or specialization.
- **Diminishing Returns**: Accuracy gains slow significantly beyond 1.5 GB for most systems.
### Interpretation
The chart demonstrates that increasing KV cache size generally improves LongBench Accuracy, but with diminishing returns. The Pareto Frontier highlights the most efficient configurations, where H2O and MiniKV excel at lower cache sizes, while SnapKV becomes competitive at higher sizes. KIVI’s single data point suggests it may be optimized for a specific use case or underrepresented in this dataset. The trend underscores the trade-off between resource allocation (cache size) and performance, guiding decisions for systems prioritizing efficiency or raw accuracy.