## Line Graphs: Normalized Power vs. Frequency Across Environments
### Overview
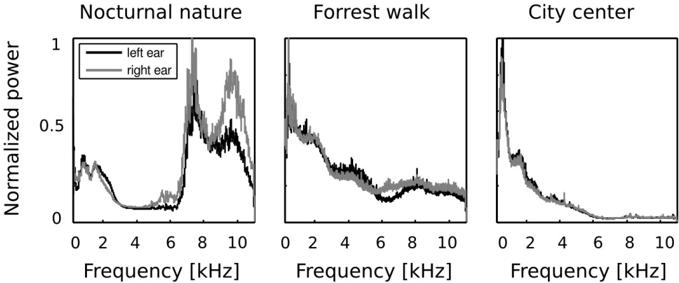
The image contains three line graphs comparing normalized power (y-axis) across frequency (x-axis) for three environments: "Nocturnal nature," "Forrest walk," and "City center." Each graph includes two data series: "left ear" (black line) and "right ear" (gray line). The graphs are positioned side-by-side, with legends in the top-left corner of each plot.
### Components/Axes
- **X-axis**: Frequency [kHz], ranging from 0 to 10 kHz in all graphs.
- **Y-axis**: Normalized power, scaled from 0 to 1.
- **Legends**:
- Top-left of each graph.
- Labels: "left ear" (black) and "right ear" (gray).
- **Graph Titles**:
- "Nocturnal nature" (leftmost graph).
- "Forrest walk" (middle graph).
- "City center" (rightmost graph).
### Detailed Analysis
#### Nocturnal nature
- **Left ear (black)**:
- Peaks at ~2.5 kHz (normalized power ~0.8) and ~7.5 kHz (normalized power ~0.7).
- Gradual decline after 8 kHz.
- **Right ear (gray)**:
- Peaks at ~2.5 kHz (normalized power ~0.6) and ~7.5 kHz (normalized power ~0.5).
- Slightly lower amplitude than left ear.
#### Forrest walk
- **Left ear (black)**:
- Gradual decline from ~0.6 at 0 kHz to ~0.2 at 10 kHz.
- No distinct peaks.
- **Right ear (gray)**:
- Similar trend to left ear but consistently ~0.1 lower across all frequencies.
#### City center
- **Left ear (black)**:
- Sharp drop at ~1 kHz (normalized power ~0.8 to ~0.2).
- Gradual decline to ~0.05 at 10 kHz.
- **Right ear (gray)**:
- Similar sharp drop at ~1 kHz (normalized power ~0.6 to ~0.1).
- Slightly lower amplitude than left ear.
### Key Observations
1. **Left ear dominance**: In all environments, the left ear consistently shows higher normalized power than the right ear.
2. **Frequency-specific patterns**:
- Nocturnal nature: Peaks at 2.5 kHz and 7.5 kHz suggest sensitivity to mid-to-high-frequency sounds.
- Forrest walk: Uniform decline indicates ambient noise reduction with increasing frequency.
- City center: Sharp drop at 1 kHz implies a dominant low-frequency noise source (e.g., traffic).
3. **Environmental contrast**:
- Nocturnal nature and Forrest walk show smoother trends, while City center exhibits abrupt changes.
### Interpretation
The data suggests that auditory sensitivity or exposure varies significantly across environments. The left ear’s consistent higher power across all graphs may indicate anatomical asymmetry or preferential sound localization. The sharp drop in the City center graph at 1 kHz aligns with urban noise profiles dominated by low-frequency sources (e.g., engines, machinery). The gradual declines in Forrest walk and Nocturnal nature graphs suggest natural environments have more balanced frequency distributions.
**Uncertainties**: Exact normalized power values are approximate due to the absence of gridlines or numerical annotations. Peak frequencies (e.g., 2.5 kHz) are estimated based on visual alignment with the x-axis.