## Line Chart: GPU Throughput vs. Hidden Size
### Overview
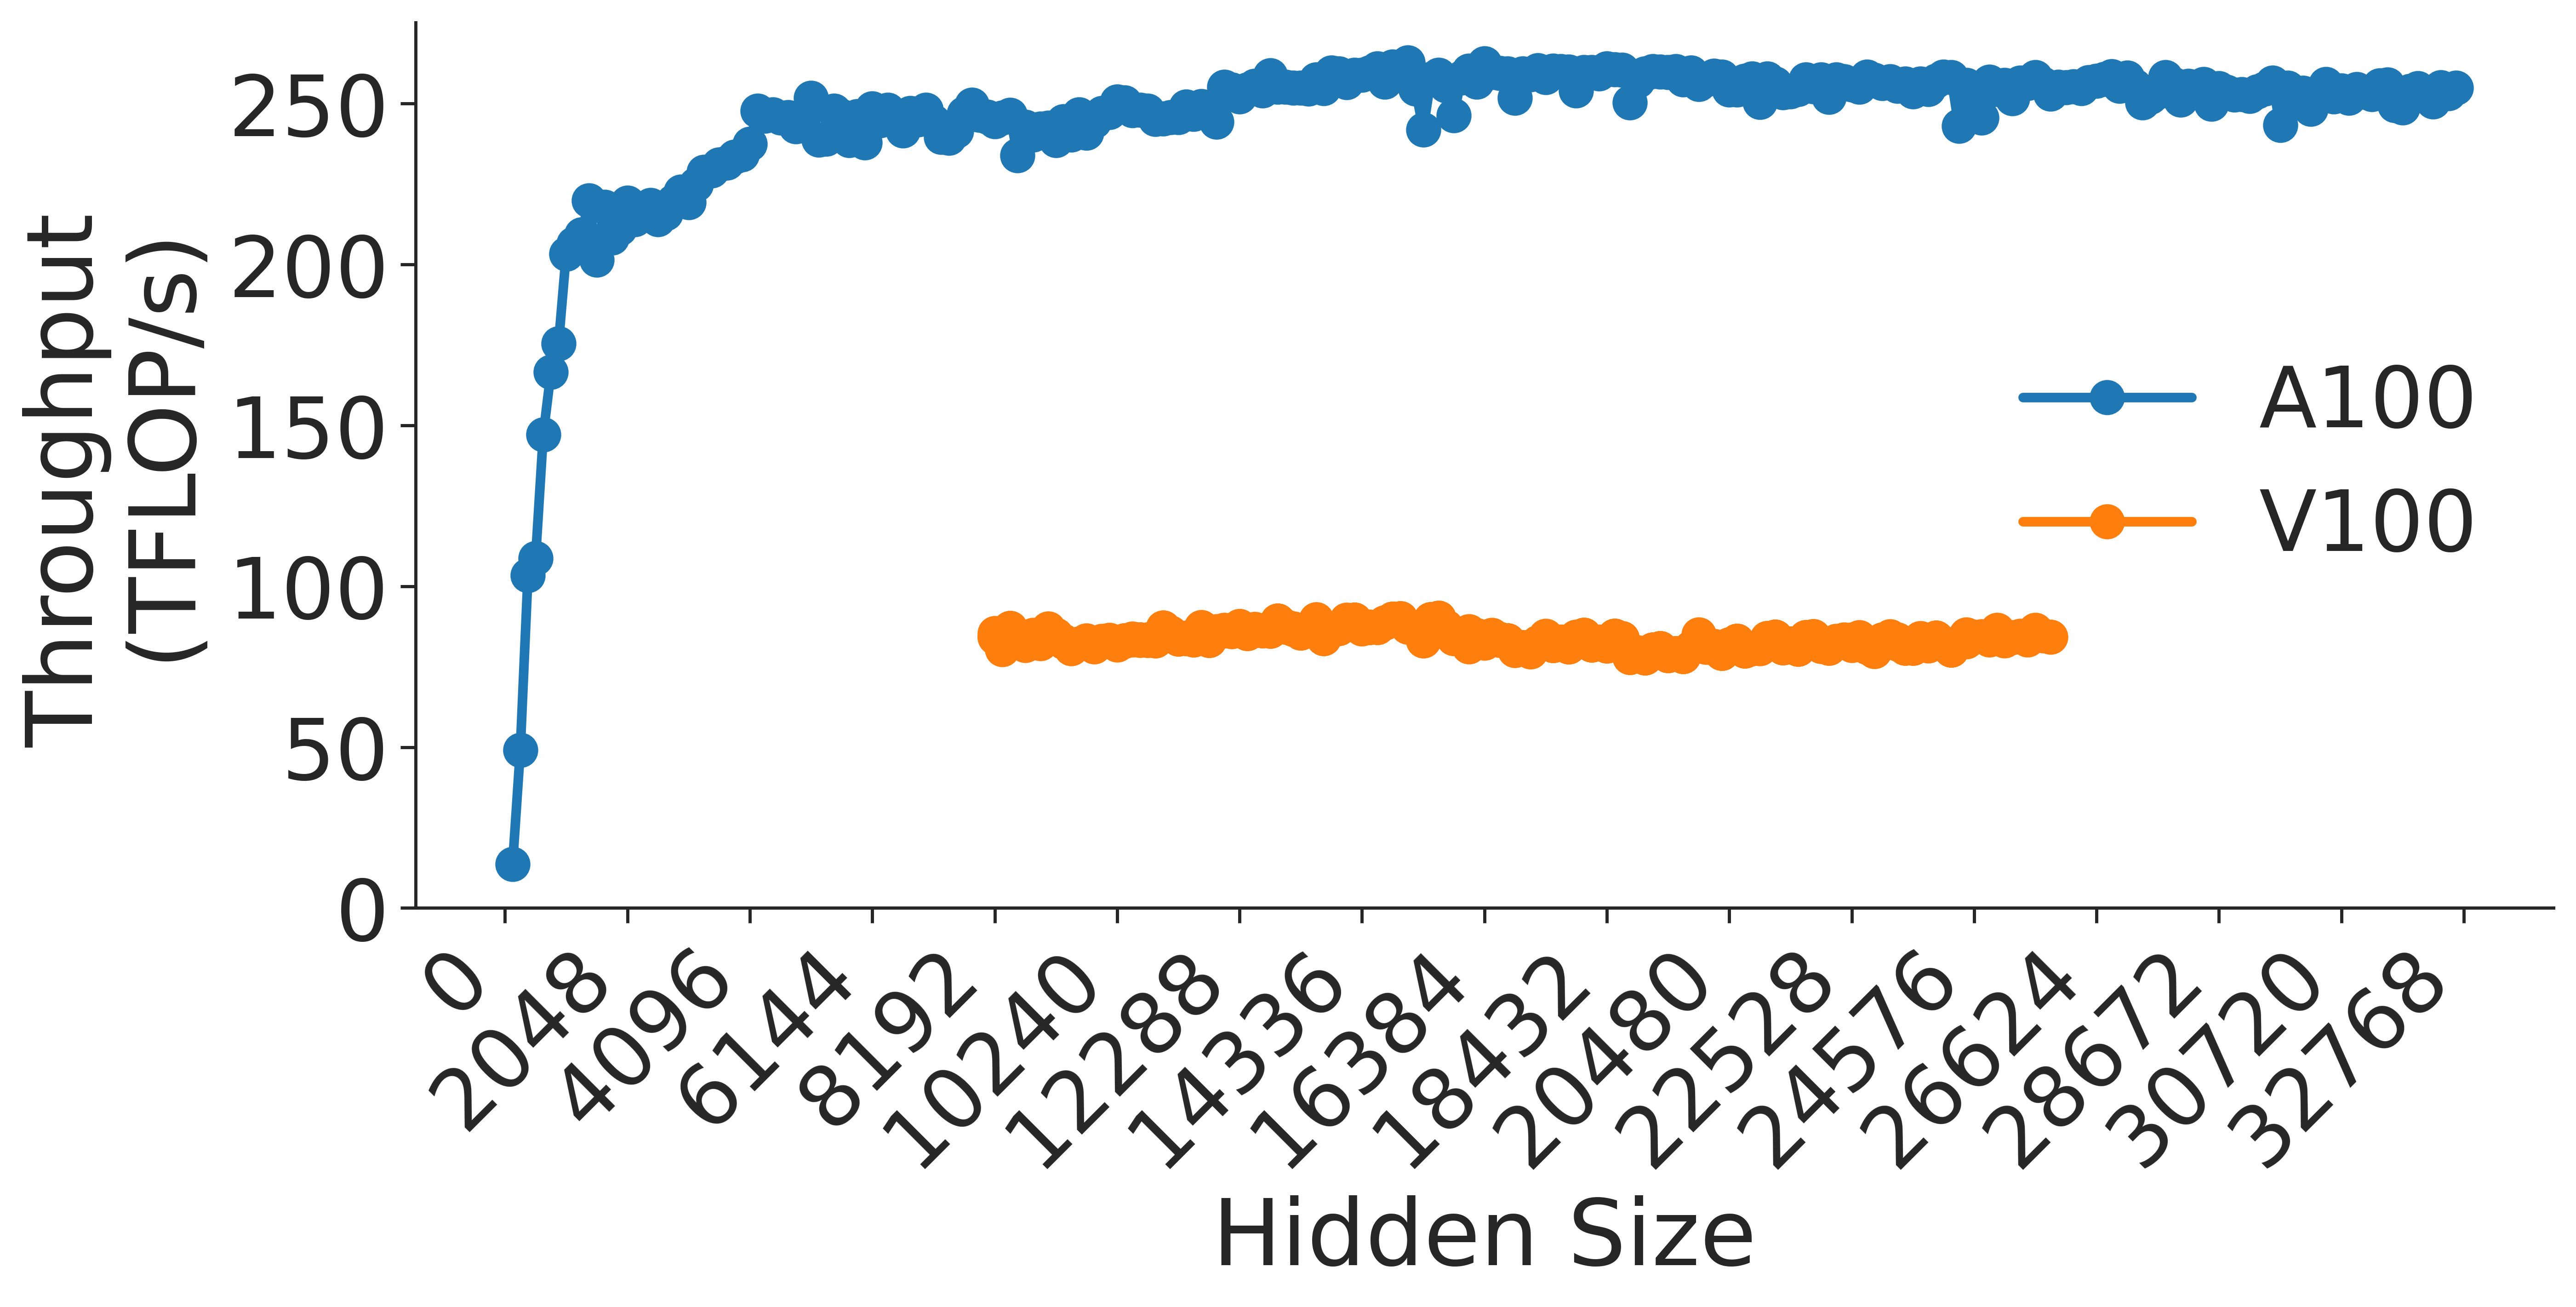
This image is a line chart comparing the computational throughput (measured in TFLOP/s) of two NVIDIA GPU architectures, the **A100** and the **V100**, across a range of "Hidden Size" parameters. The chart demonstrates that the A100 provides significantly higher throughput than the V100 and exhibits a distinct performance ramp-up phase at lower hidden sizes.
### Components/Axes
* **Y-Axis (Vertical):** Labeled "Throughput (TFLOP/s)". The scale ranges from 0 to 250 in increments of 50.
* **X-Axis (Horizontal):** Labeled "Hidden Size". The scale ranges from 0 to 32768. The labels are rotated 45 degrees for readability. The specific markers are: 0, 2048, 4096, 6144, 8192, 10240, 12288, 14336, 16384, 18432, 20480, 22528, 24576, 26624, 28672, 30720, 32768.
* **Legend:** Located in the middle-right area of the chart.
* **Blue line with blue circles:** Labeled "A100".
* **Orange line with orange circles:** Labeled "V100".
### Detailed Analysis
#### Data Series 1: A100 (Blue)
* **Trend:** The A100 series shows a steep, near-vertical upward slope from a hidden size of 0 to approximately 2048. Following this initial ramp-up, the trend transitions into a plateau, maintaining a relatively stable throughput for the remainder of the X-axis.
* **Values:**
* Starts at approximately 15 TFLOP/s at a hidden size of 0.
* Reaches approximately 200 TFLOP/s at a hidden size of 2048.
* Plateaus between 240 and 260 TFLOP/s for all hidden sizes greater than 4096.
#### Data Series 2: V100 (Orange)
* **Trend:** The V100 series is characterized by a flat, horizontal trend. It does not appear on the chart until a hidden size of approximately 10240.
* **Values:**
* The data points consistently hover between 80 and 90 TFLOP/s across the entire range (from 10240 to 28672).
### Key Observations
* **Performance Gap:** The A100 consistently outperforms the V100 by a factor of approximately 3x (roughly 250 TFLOP/s vs. 85 TFLOP/s).
* **Data Availability:** The V100 data is only plotted for larger hidden sizes (starting at 10240), whereas the A100 data covers the full range from 0 to 32768.
* **Stability:** Both GPUs show relatively stable performance once they reach their respective operational thresholds, with the A100 showing minor fluctuations around the 250 TFLOP/s mark.
### Interpretation
This chart serves as a performance benchmark for deep learning or matrix multiplication workloads.
* **Efficiency Ramp-up:** The A100's sharp rise at the beginning suggests that it requires a certain minimum "Hidden Size" (workload complexity) to saturate its compute units and reach peak efficiency.
* **Hardware Capability:** The A100 is clearly the superior hardware for this specific workload, offering significantly higher throughput.
* **Workload Suitability:** The V100's flat performance suggests it is likely compute-bound or memory-bandwidth-bound at a lower ceiling than the A100. The absence of V100 data at lower hidden sizes might imply that the testing methodology or the specific kernel implementation used for the V100 was not optimized or applicable for smaller hidden sizes.
* **Peircean Investigative Note:** The visual "gap" between the two lines is the most salient feature. The A100 is not just faster; it operates in an entirely different performance tier. The plateauing of both lines suggests that for hidden sizes above ~10,000, the throughput is no longer scaling significantly with the hidden size, indicating that the GPUs have reached their maximum throughput capacity for this specific operation.