## Line Chart: Model Performance with Feature Inclusion
### Overview
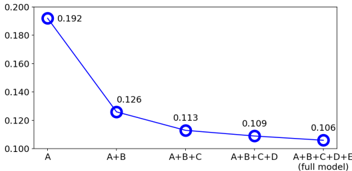
The image is a line chart illustrating the performance of a model as features are added incrementally. The x-axis represents the features included in the model (A, A+B, A+B+C, A+B+C+D, A+B+C+D+E), and the y-axis represents a performance metric, presumably an error rate or loss, ranging from 0.100 to 0.200. The line shows a decreasing trend, indicating that adding more features generally improves the model's performance.
### Components/Axes
* **X-axis:** Represents the features included in the model. The categories are:
* A
* A+B
* A+B+C
* A+B+C+D
* A+B+C+D+E (full model)
* **Y-axis:** Represents the performance metric, ranging from 0.100 to 0.200 in increments of 0.020.
* 0.100
* 0.120
* 0.140
* 0.160
* 0.180
* 0.200
* **Line:** A blue line connects the data points, showing the trend in model performance.
### Detailed Analysis
The blue line starts at a value of 0.192 when only feature A is included. As more features are added, the line slopes downward, indicating improved performance.
* **A:** 0.192
* **A+B:** 0.126
* **A+B+C:** 0.113
* **A+B+C+D:** 0.109
* **A+B+C+D+E (full model):** 0.106
### Key Observations
* The most significant performance improvement occurs when feature B is added to feature A (from 0.192 to 0.126).
* The performance improvement diminishes as more features are added beyond A+B.
* The full model (A+B+C+D+E) achieves the best performance, with a value of 0.106.
### Interpretation
The chart suggests that adding features to the model generally improves its performance, as indicated by the decreasing trend of the line. However, the marginal benefit of adding each additional feature decreases as more features are included. The most significant improvement comes from adding feature B to feature A. This could indicate that feature B is highly informative or complementary to feature A. The full model achieves the best performance, but the difference between the performance of A+B+C+D and the full model is relatively small, suggesting that features C, D, and E contribute less to the model's performance than features A and B.