## Chart Compilation: Evaluation of RAG vs. Non-RAG Systems
### Overview
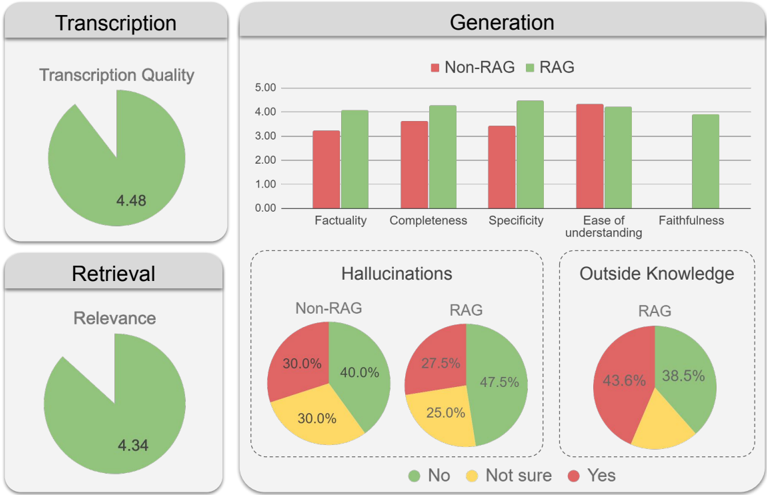
This image presents a compilation of charts evaluating the performance of systems with and without Retrieval-Augmented Generation (RAG) across several metrics: Transcription Quality, Generation (Factuality, Completeness, Specificity, Ease of Understanding, Faithfulness), Retrieval Relevance, Hallucinations, and Outside Knowledge. The charts primarily use bar graphs and pie charts to visualize the data.
### Components/Axes
The image is divided into four main sections: Transcription, Generation, Retrieval, and Hallucinations/Outside Knowledge.
* **Transcription Quality:** Pie chart with a single value.
* **Generation:** Bar graph with five metrics on the x-axis (Factuality, Completeness, Specificity, Ease of Understanding, Faithfulness) and a y-axis ranging from 0.00 to 5.00. Two data series are presented: Non-RAG (red) and RAG (green).
* **Retrieval Relevance:** Pie chart with a single value.
* **Hallucinations:** Two pie charts, one for Non-RAG and one for RAG, showing the distribution of responses categorized as "No", "Not Sure", and "Yes".
* **Outside Knowledge:** Pie chart for RAG, showing the distribution of responses categorized as "No", "Not Sure", and "Yes".
* **Legend:** Located at the bottom-center of the image, defining the colors for "No" (green), "Not Sure" (yellow), and "Yes" (red). The Generation chart legend is at the top-right, defining "Non-RAG" (red) and "RAG" (green).
### Detailed Analysis or Content Details
**1. Transcription Quality:**
* The pie chart shows a Transcription Quality score of approximately 4.48.
**2. Generation:**
* **Factuality:** Non-RAG is approximately 2.7, RAG is approximately 4.0.
* **Completeness:** Non-RAG is approximately 2.8, RAG is approximately 4.0.
* **Specificity:** Non-RAG is approximately 2.5, RAG is approximately 3.5.
* **Ease of Understanding:** Non-RAG is approximately 3.0, RAG is approximately 4.0.
* **Faithfulness:** Non-RAG is approximately 3.0, RAG is approximately 4.0.
* *Trend:* For all five metrics, the RAG data series consistently outperforms the Non-RAG data series, with RAG bars being significantly higher.
**3. Retrieval Relevance:**
* The pie chart shows a Retrieval Relevance score of approximately 4.34.
**4. Hallucinations (Non-RAG):**
* No: 30.0%
* Not Sure: 30.0%
* Yes: 40.0%
**5. Hallucinations (RAG):**
* No: 47.5%
* Not Sure: 25.0%
* Yes: 27.5%
**6. Outside Knowledge (RAG):**
* No: 43.36%
* Not Sure: 38.5%
* Yes: 18.14%
### Key Observations
* RAG consistently outperforms Non-RAG across all Generation metrics.
* RAG significantly reduces the occurrence of hallucinations compared to Non-RAG.
* The majority of responses from RAG indicate "No" outside knowledge, with a substantial portion being "Not Sure".
* Transcription and Retrieval Relevance both have high scores, around 4.3-4.5.
### Interpretation
The data strongly suggests that incorporating Retrieval-Augmented Generation (RAG) significantly improves the quality of generated text. RAG leads to higher factuality, completeness, specificity, ease of understanding, and faithfulness compared to systems without RAG. Furthermore, RAG demonstrably reduces the frequency of hallucinations.
The "Outside Knowledge" pie chart for RAG indicates that the system primarily relies on retrieved information, as the majority of responses indicate "No" outside knowledge. The substantial "Not Sure" category suggests that the system is cautious about asserting information not directly supported by the retrieved context.
The high scores for Transcription Quality and Retrieval Relevance suggest that the underlying retrieval and transcription components are performing well, providing a solid foundation for the generation process. The consistent improvement across all metrics when RAG is employed highlights its effectiveness in enhancing the overall performance of the system. The data suggests that RAG is a valuable technique for building more reliable and trustworthy language models.