## Line Graph: Benchmark: AIME25
### Overview
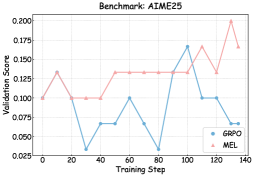
The image is a line graph comparing the validation scores of two methods, **GRPO** (blue) and **MEL** (pink), across training steps (0–140). The y-axis represents validation scores (0.025–0.200), while the x-axis represents training steps. The graph highlights performance trends, with MEL generally outperforming GRPO in later stages.
---
### Components/Axes
- **Title**: "Benchmark: AIME25" (top center).
- **X-axis**: "Training Step" (0–140, increments of 20).
- **Y-axis**: "Validation Score" (0.025–0.200, increments of 0.025).
- **Legend**: Bottom-right corner, with:
- **Blue**: GRPO
- **Pink**: MEL
---
### Detailed Analysis
#### GRPO (Blue Line)
- **Initial Phase (0–30 steps)**: Starts at 0.100, dips sharply to 0.025 at step 30.
- **Mid-Phase (30–80 steps)**: Fluctuates between 0.025 and 0.100, with a peak at 0.100 at step 60.
- **Late Phase (80–140 steps)**: Rises to 0.175 at step 100, then drops to 0.100 at step 120, ending at 0.075 at step 140.
#### MEL (Pink Line)
- **Initial Phase (0–40 steps)**: Starts at 0.100, peaks at 0.130 at step 10, remains flat until step 40.
- **Mid-Phase (40–80 steps)**: Rises to 0.130 at step 50, stays flat until step 80.
- **Late Phase (80–140 steps)**: Jumps to 0.175 at step 110, drops to 0.130 at step 120, peaks at 0.200 at step 130, and ends at 0.165 at step 140.
---
### Key Observations
1. **GRPO Volatility**: The blue line exhibits significant fluctuations, with sharp dips (e.g., 0.025 at steps 30 and 80) and peaks (0.175 at step 100).
2. **MEL Stability**: The pink line shows smoother trends, with gradual increases and fewer extreme drops.
3. **Performance Divergence**: MEL outperforms GRPO in later training steps (e.g., 0.200 at step 130 vs. GRPO’s 0.175 at step 100).
4. **Final Scores**: At step 140, MEL ends at 0.165, while GRPO ends at 0.075.
---
### Interpretation
- **Model Reliability**: MEL demonstrates greater consistency and higher validation scores, suggesting it is more robust for the AIME25 benchmark.
- **GRPO Instability**: The blue line’s volatility may indicate challenges in learning or overfitting, particularly in early and mid-training phases.
- **Late-Stage Advantage**: MEL’s sharp rise after step 100 implies it adapts better to complex patterns in later training stages.
- **Practical Implications**: For applications requiring stable performance, MEL is preferable. GRPO’s fluctuations might necessitate further tuning or regularization.
---
### Spatial Grounding
- **Legend**: Bottom-right corner, clearly associating colors with methods.
- **Data Points**: All values align with legend colors (e.g., pink for MEL, blue for GRPO).
- **Axis Labels**: Centered and legible, with numerical increments explicitly marked.
---
### Content Details
- **GRPO Data Points**:
- 0: 0.100
- 10: 0.100
- 20: 0.100
- 30: 0.025
- 40: 0.075
- 50: 0.075
- 60: 0.100
- 70: 0.075
- 80: 0.025
- 90: 0.100
- 100: 0.175
- 110: 0.100
- 120: 0.100
- 130: 0.075
- 140: 0.075
- **MEL Data Points**:
- 0: 0.100
- 10: 0.130
- 20: 0.130
- 30: 0.130
- 40: 0.130
- 50: 0.130
- 60: 0.130
- 70: 0.130
- 80: 0.130
- 90: 0.130
- 100: 0.130
- 110: 0.175
- 120: 0.130
- 130: 0.200
- 140: 0.165
---
### Final Notes
The graph emphasizes the trade-off between stability and performance. While GRPO shows potential in mid-training, MEL’s late-stage dominance suggests it is better suited for tasks requiring sustained accuracy. Further analysis could explore hyperparameter tuning for GRPO to mitigate its volatility.