\n
## Grouped Bar Chart: Absolute Performance by Hops
### Overview
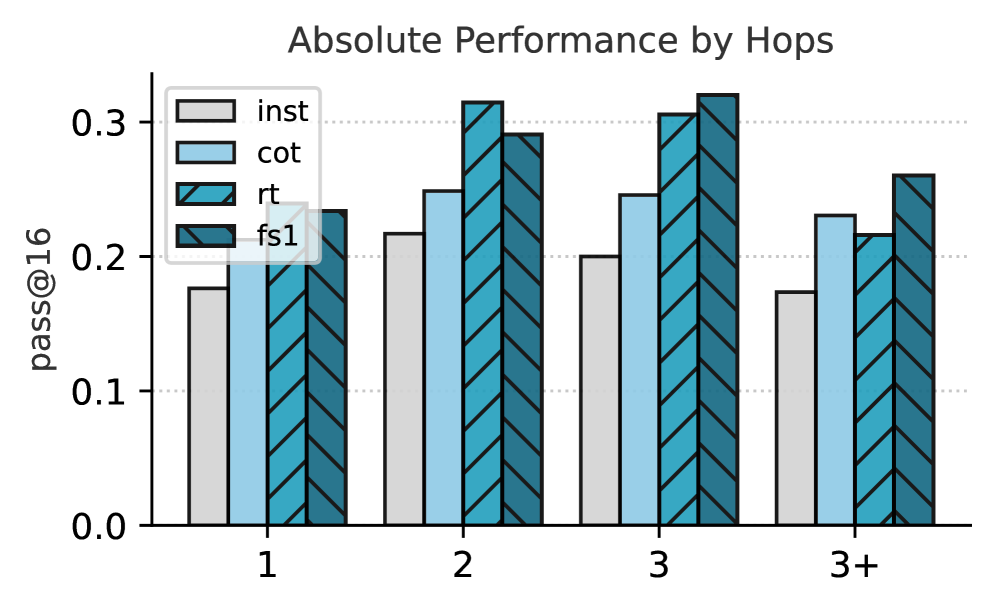
This is a grouped bar chart titled "Absolute Performance by Hops." It compares the performance of four different methods or models (labeled "inst", "cot", "rt", and "fs1") across four categories of increasing complexity, defined by the number of "hops" (1, 2, 3, and 3+). Performance is measured by the metric "pass@16" on the y-axis.
### Components/Axes
* **Title:** "Absolute Performance by Hops" (centered at the top).
* **Y-Axis:**
* **Label:** "pass@16" (rotated vertically on the left).
* **Scale:** Linear scale from 0.0 to 0.3, with major tick marks at 0.0, 0.1, 0.2, and 0.3.
* **X-Axis:**
* **Categories (Hops):** Four discrete groups labeled "1", "2", "3", and "3+".
* **Legend:** Located in the top-left corner of the plot area. It defines four data series:
1. `inst`: Light gray solid bar.
2. `cot`: Light blue solid bar.
3. `rt`: Teal bar with diagonal hatching (stripes running from top-left to bottom-right).
4. `fs1`: Darker teal bar with diagonal hatching (stripes running from top-right to bottom-left).
### Detailed Analysis
The chart displays the approximate "pass@16" values for each method within each hop category. Values are estimated based on bar height relative to the y-axis grid lines.
**Hop 1:**
* `inst` (light gray): ~0.18
* `cot` (light blue): ~0.24
* `rt` (teal, hatched): ~0.23
* `fs1` (dark teal, hatched): ~0.24
**Hop 2:**
* `inst`: ~0.22
* `cot`: ~0.25
* `rt`: ~0.31
* `fs1`: ~0.29
**Hop 3:**
* `inst`: ~0.20
* `cot`: ~0.25
* `rt`: ~0.305
* `fs1`: ~0.315
**Hop 3+:**
* `inst`: ~0.175
* `cot`: ~0.23
* `rt`: ~0.215
* `fs1`: ~0.26
### Key Observations
1. **Performance Peak:** The highest overall performance is achieved by the `fs1` method at 3 hops (~0.315) and the `rt` method at 2 hops (~0.31).
2. **Method Trends:**
* `inst`: Performance increases from 1 to 2 hops, then declines at 3 and 3+ hops.
* `cot`: Performance is relatively stable between 1, 2, and 3 hops (~0.24-0.25), then drops at 3+ hops.
* `rt`: Shows a strong peak at 2 hops, with lower performance at 1, 3, and especially 3+ hops.
* `fs1`: Performance increases steadily from 1 to 3 hops, peaking at 3, before declining at 3+ hops.
3. **Relative Performance:** At lower complexity (1 hop), `cot`, `rt`, and `fs1` perform similarly and better than `inst`. At medium complexity (2-3 hops), `rt` and `fs1` clearly outperform `inst` and `cot`. At the highest complexity (3+ hops), `fs1` maintains the lead, while `rt` performance drops significantly.
### Interpretation
This chart visualizes how different reasoning or execution strategies ("inst", "cot", "rt", "fs1") scale with problem complexity, measured in "hops" (likely representing reasoning steps or dependencies).
* **Scalability:** The data suggests that the `fs1` strategy scales the most robustly, maintaining the highest performance at the most complex level (3+ hops). The `rt` strategy is highly effective for medium complexity (2 hops) but does not scale as well to the highest complexity.
* **Strategy Effectiveness:** There is no single best strategy for all complexity levels. The optimal choice depends on the expected number of hops. `cot` and `inst` are consistently outperformed by `rt` and `fs1` at medium to high complexities.
* **The "3+" Category:** The drop in performance for all methods at the "3+" category indicates a significant increase in difficulty beyond 3 hops, posing a challenge for all evaluated strategies. The fact that `fs1` retains the highest performance here suggests it may have architectural or methodological advantages for handling very complex, multi-step problems.
The metric "pass@16" likely measures success rate (e.g., solving a problem correctly in 16 attempts), so higher values are better. The chart effectively communicates that problem complexity (hops) is a critical factor in determining which AI reasoning method will be most successful.