\n
## Bar Chart: Model Performance Comparison
### Overview
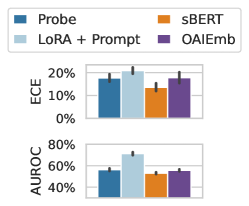
The image presents a comparison of four different models – Probe, LoRA + Prompt, sBERT, and OAIEmb – based on two metrics: Expected Calibration Error (ECE) and Area Under the Receiver Operating Characteristic curve (AUROC). The data is visualized using bar charts with error bars.
### Components/Axes
* **X-axis:** Represents the four models: Probe, LoRA + Prompt, sBERT, and OAIEmb.
* **Y-axis (Top Chart):** Expected Calibration Error (ECE), ranging from 0% to 20%.
* **Y-axis (Bottom Chart):** Area Under the Receiver Operating Characteristic curve (AUROC), ranging from 40% to 80%.
* **Legend:** Located at the top-left of the image, mapping colors to models:
* Probe (Blue)
* LoRA + Prompt (Light Blue)
* sBERT (Orange)
* OAIEmb (Purple)
* **Error Bars:** Present on each bar, indicating the variability or uncertainty in the measurements.
### Detailed Analysis
**Top Chart: ECE**
* **Probe (Blue):** The bar is approximately at 16% with an error bar extending to roughly 18%.
* **LoRA + Prompt (Light Blue):** The bar is the highest, at approximately 18% with an error bar extending to roughly 20%.
* **sBERT (Orange):** The bar is approximately at 14% with an error bar extending to roughly 16%.
* **OAIEmb (Purple):** The bar is approximately at 15% with an error bar extending to roughly 17%.
**Bottom Chart: AUROC**
* **Probe (Blue):** The bar is approximately at 54% with an error bar extending to roughly 56%.
* **LoRA + Prompt (Light Blue):** The bar is the highest, at approximately 68% with an error bar extending to roughly 70%.
* **sBERT (Orange):** The bar is approximately at 52% with an error bar extending to roughly 54%.
* **OAIEmb (Purple):** The bar is approximately at 55% with an error bar extending to roughly 57%.
### Key Observations
* **LoRA + Prompt consistently outperforms other models** in both ECE and AUROC. It has the highest AUROC and the highest ECE.
* **Probe and sBERT show similar performance** across both metrics.
* **OAIEmb's performance is intermediate** between Probe/sBERT and LoRA + Prompt.
* **ECE is inversely related to AUROC.** Higher AUROC values generally correspond to lower ECE values.
### Interpretation
The data suggests that the LoRA + Prompt model achieves the best discrimination performance (highest AUROC) but is also the least well-calibrated (highest ECE). This means that while it is good at predicting the correct class, its confidence scores are not well-aligned with its actual accuracy. Probe and sBERT offer a balance between calibration and discrimination, while OAIEmb falls in between. The error bars indicate that the differences between some models may not be statistically significant. The choice of model depends on the specific application and the relative importance of calibration versus discrimination. If accurate confidence scores are crucial, a model with lower ECE might be preferred, even if it has a slightly lower AUROC. If maximizing predictive accuracy is the primary goal, LoRA + Prompt might be the best choice.