\n
## Diagram: Binary Tree Representation
### Overview
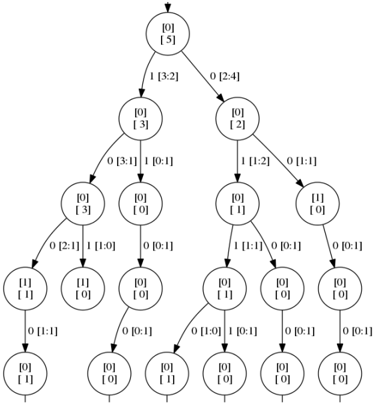
The image depicts a binary tree diagram. Each node in the tree contains two values enclosed in square brackets. Arrows indicate the direction of flow from parent to child nodes. The diagram appears to represent a hierarchical structure, potentially related to data partitioning or decision-making processes.
### Components/Axes
The diagram consists of nodes connected by directed edges (arrows). Each node displays two numerical values: the first value is enclosed in square brackets, and the second value is enclosed in square brackets. The edges are labeled with values in the format "0 [x:y]" or "1 [x:y]", indicating a binary choice or split.
### Detailed Analysis or Content Details
The tree structure unfolds as follows, starting from the root:
* **Root Node:** \[0] \[5]
* **Level 1 (Left Branch):** \[0] \[3] - Connected by arrow labeled "0 [2:4]"
* **Level 1 (Right Branch):** \[0] \[2] - Connected by arrow labeled "1 [2:4]"
* **Level 2 (Left-Left Branch):** \[0] \[3] - Connected by arrow labeled "0 [3:1]"
* **Level 2 (Left-Right Branch):** \[0] \[0] - Connected by arrow labeled "1 [0:1]"
* **Level 2 (Right-Left Branch):** \[0] \[1] - Connected by arrow labeled "1 [1:2]"
* **Level 2 (Right-Right Branch):** \[1] \[0] - Connected by arrow labeled "0 [1:1]"
* **Level 3 (Left-Left-Left Branch):** \[1] \[1] - Connected by arrow labeled "0 [2:1]"
* **Level 3 (Left-Left-Right Branch):** \[0] \[1] - Connected by arrow labeled "1 [1:0]"
* **Level 3 (Left-Right-Left Branch):** \[0] \[0] - Connected by arrow labeled "0 [0:1]"
* **Level 3 (Left-Right-Right Branch):** \[0] \[1] - Connected by arrow labeled "1 [0:1]"
* **Level 3 (Right-Left-Left Branch):** \[1] \[1] - Connected by arrow labeled "1 [1:1]"
* **Level 3 (Right-Left-Right Branch):** \[0] \[0] - Connected by arrow labeled "0 [0:1]"
* **Level 3 (Right-Right-Left Branch):** \[0] \[1] - Connected by arrow labeled "0 [0:1]"
* **Level 3 (Right-Right-Right Branch):** \[0] \[0] - Connected by arrow labeled "1 [0:1]"
* **Level 4 (Left-Left-Left-Left Branch):** \[1] \[1] - Connected by arrow labeled "0 [1:1]"
* **Level 4 (Left-Left-Left-Right Branch):** \[0] \[1] - Connected by arrow labeled "1 [1:1]"
* **Level 4 (Left-Left-Right-Left Branch):** \[0] \[0] - Connected by arrow labeled "0 [0:1]"
* **Level 4 (Left-Left-Right-Right Branch):** \[0] \[1] - Connected by arrow labeled "1 [0:1]"
* **Level 4 (Left-Right-Left-Left Branch):** \[0] \[0] - Connected by arrow labeled "0 [0:1]"
* **Level 4 (Left-Right-Left-Right Branch):** \[0] \[1] - Connected by arrow labeled "1 [0:1]"
* **Level 4 (Left-Right-Right-Left Branch):** \[0] \[0] - Connected by arrow labeled "0 [0:1]"
* **Level 4 (Left-Right-Right-Right Branch):** \[0] \[0] - Connected by arrow labeled "1 [0:1]"
* **Level 4 (Right-Left-Left-Left Branch):** \[1] \[1] - Connected by arrow labeled "0 [1:1]"
* **Level 4 (Right-Left-Left-Right Branch):** \[0] \[0] - Connected by arrow labeled "1 [1:1]"
* **Level 4 (Right-Left-Right-Left Branch):** \[0] \[0] - Connected by arrow labeled "0 [0:1]"
* **Level 4 (Right-Left-Right-Right Branch):** \[0] \[0] - Connected by arrow labeled "1 [0:1]"
* **Level 4 (Right-Right-Left-Left Branch):** \[0] \[1] - Connected by arrow labeled "0 [0:1]"
* **Level 4 (Right-Right-Left-Right Branch):** \[0] \[0] - Connected by arrow labeled "1 [0:1]"
* **Level 4 (Right-Right-Right-Left Branch):** \[0] \[0] - Connected by arrow labeled "0 [0:1]"
* **Level 4 (Right-Right-Right-Right Branch):** \[0] \[0] - Connected by arrow labeled "1 [0:1]"
### Key Observations
The values within the nodes consistently alternate between 0 and 1. The labels on the edges follow a consistent pattern of "0 [x:y]" or "1 [x:y]". The tree expands in a balanced manner, with each node having at most two children. The values of 'x' and 'y' in the edge labels appear to define a range or interval.
### Interpretation
This diagram likely represents a decision tree or a partitioning of data based on binary choices. The "0" and "1" labels on the edges could represent "true" or "false" conditions, or simply two distinct categories. The values within the square brackets, \[x:y], likely represent the range of data or the number of elements associated with that branch. The root node \[0] \[5] suggests an initial dataset of size 5, which is then recursively divided into smaller subsets based on the binary decisions represented by the edges. The consistent presence of 0 and 1 suggests a binary classification or partitioning scheme. The diagram could be used to visualize a search algorithm, a classification model, or a data compression technique. The depth of the tree indicates the number of decision levels or partitioning steps involved.