TECHNICAL ASSET FINGERPRINT
706d7cef152570c7a71ce787
Click to view fullscreen
Press ESC or click to close
FOUND IN PAPERS
EXPERT: healer-alpha-free VERSION 1
RUNTIME: free/openrouter/healer-alpha
INTEL_VERIFIED
\n
## Heatmap: Cross-Dataset Performance
### Overview
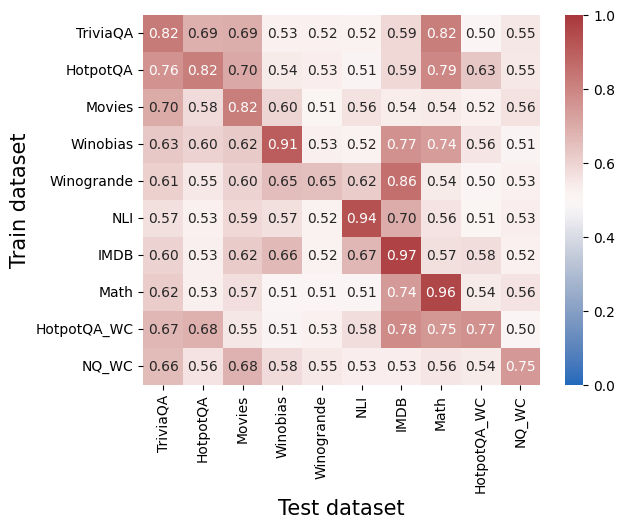
The image is a heatmap visualizing a matrix of numerical performance scores (likely accuracy, F1, or a similar metric) between different "Train datasets" (rows) and "Test datasets" (columns). The values range from 0.0 to 1.0, with a color gradient from blue (low) to red (high) indicating the score. The chart is designed to show how well a model trained on one dataset generalizes to another.
### Components/Axes
* **Y-Axis (Vertical):** Labeled **"Train dataset"**. It lists 10 datasets used for training:
1. TriviaQA
2. HotpotQA
3. Movies
4. Winobias
5. Winogrande
6. NLI
7. IMDB
8. Math
9. HotpotQA_WC
10. NQ_WC
* **X-Axis (Horizontal):** Labeled **"Test dataset"**. It lists the same 10 datasets used for testing, in the same order as the Y-axis.
* **Color Scale/Legend:** Located on the right side of the chart. It is a vertical bar showing the mapping of color to numerical value.
* **Range:** 0.0 (bottom, blue) to 1.0 (top, red).
* **Key Markers:** 0.0, 0.2, 0.4, 0.6, 0.8, 1.0.
* **Data Grid:** A 10x10 grid of colored cells. Each cell contains a numerical value (to two decimal places) representing the performance score for the corresponding Train-Test dataset pair.
### Detailed Analysis
The following table reconstructs the entire data matrix. Values are transcribed directly from the image. Rows represent the "Train dataset" and columns represent the "Test dataset".
| Train \ Test | TriviaQA | HotpotQA | Movies | Winobias | Winogrande | NLI | IMDB | Math | HotpotQA_WC | NQ_WC |
| :--- | :---: | :---: | :---: | :---: | :---: | :---: | :---: | :---: | :---: | :---: |
| **TriviaQA** | **0.82** | 0.69 | 0.69 | 0.53 | 0.52 | 0.52 | 0.59 | 0.82 | 0.50 | 0.55 |
| **HotpotQA** | 0.76 | **0.82** | 0.70 | 0.54 | 0.53 | 0.51 | 0.59 | 0.79 | 0.63 | 0.55 |
| **Movies** | 0.70 | 0.58 | **0.82** | 0.60 | 0.51 | 0.56 | 0.54 | 0.54 | 0.52 | 0.56 |
| **Winobias** | 0.63 | 0.60 | 0.62 | **0.91** | 0.53 | 0.52 | 0.77 | 0.74 | 0.56 | 0.51 |
| **Winogrande** | 0.61 | 0.55 | 0.60 | 0.65 | **0.65** | 0.62 | 0.86 | 0.54 | 0.50 | 0.53 |
| **NLI** | 0.57 | 0.53 | 0.59 | 0.57 | 0.52 | **0.94** | 0.70 | 0.56 | 0.51 | 0.53 |
| **IMDB** | 0.60 | 0.53 | 0.62 | 0.66 | 0.52 | 0.67 | **0.97** | 0.57 | 0.58 | 0.52 |
| **Math** | 0.62 | 0.53 | 0.57 | 0.51 | 0.51 | 0.51 | 0.74 | **0.96** | 0.54 | 0.56 |
| **HotpotQA_WC** | 0.67 | 0.68 | 0.55 | 0.51 | 0.53 | 0.58 | 0.78 | 0.75 | **0.77** | 0.50 |
| **NQ_WC** | 0.66 | 0.56 | 0.68 | 0.58 | 0.55 | 0.53 | 0.53 | 0.56 | 0.54 | **0.75** |
**Trend Verification & Spatial Grounding:**
* **Diagonal Trend:** The cells where the Train and Test dataset are the same (the main diagonal from top-left to bottom-right) are consistently the highest values in their respective rows and are colored dark red. This indicates strong within-dataset performance.
* **High Off-Diagonal Values:** Notable high scores exist between related datasets. For example:
* Train: **Winobias** (0.91) -> Test: **Winobias** (dark red).
* Train: **IMDB** (0.97) -> Test: **IMDB** (darkest red on the chart).
* Train: **NLI** (0.94) -> Test: **NLI** (dark red).
* Train: **Winogrande** (0.86) -> Test: **IMDB** (medium red).
* Train: **TriviaQA** (0.82) -> Test: **Math** (medium red).
* **Low Values:** The lowest scores (lightest colors, near 0.5) are often found in the lower-right quadrant of the matrix, particularly when training on QA datasets (TriviaQA, HotpotQA) and testing on others, or vice-versa.
### Key Observations
1. **Strongest Performance:** The single highest score is **0.97** for the **IMDB** train/test pair.
2. **Weakest Performance:** The lowest scores appear to be around **0.50-0.51**. Examples include:
* Train: **TriviaQA** -> Test: **HotpotQA_WC** (0.50)
* Train: **HotpotQA_WC** -> Test: **NQ_WC** (0.50)
* Train: **Winobias** -> Test: **NQ_WC** (0.51)
* Train: **NLI** -> Test: **HotpotQA_WC** (0.51)
3. **Dataset Clusters:** Some datasets show stronger cross-performance:
* **IMDB** and **Winogrande** have a high mutual score (Train Winogrande -> Test IMDB = 0.86).
* **TriviaQA** and **Math** show a surprisingly high transfer (Train TriviaQA -> Test Math = 0.82).
* **HotpotQA** and **HotpotQA_WC** show moderate transfer (0.63 and 0.68 in respective directions).
4. **Asymmetry:** Performance is not always symmetric. For example:
* Train on **Winobias**, Test on **IMDB**: **0.77**
* Train on **IMDB**, Test on **Winobias**: **0.66**
### Interpretation
This heatmap provides a diagnostic view of model generalization across diverse NLP tasks (Question Answering, Commonsense Reasoning, Sentiment Analysis, Natural Language Inference, etc.).
* **What it demonstrates:** The high diagonal values confirm that models perform best when tested on the same distribution they were trained on. The off-diagonal values reveal the **transfer learning potential** between datasets. High off-diagonal scores suggest the datasets share underlying features or task structures that a model can leverage.
* **Relationships between elements:** The matrix acts as a similarity map. Datasets that are "close" in this map (high mutual scores, like IMDB and Winogrande) are likely more similar in the skills they require or the data patterns they contain. Datasets with low mutual scores are more distinct.
* **Notable anomalies/patterns:**
* The very high transfer from **TriviaQA to Math** (0.82) is intriguing and suggests the reasoning or retrieval skills from TriviaQA might be highly applicable to the Math dataset used here.
* The **IMDB** dataset appears to be both very easy to master (0.97 self-score) and a good source for training models that perform well on other tasks (e.g., 0.86 on Winogrande, 0.78 on HotpotQA_WC). This could indicate it's a strong, general-purpose sentiment or text feature dataset.
* The **QA datasets (TriviaQA, HotpotQA, NQ_WC)** generally show lower cross-performance with other dataset types, suggesting their specific QA format or knowledge requirements are less transferable to tasks like sentiment analysis (IMDB) or natural language inference (NLI).
* The **"WC" variants** (HotpotQA_WC, NQ_WC) likely stand for "Without Context" or a similar modification. Their generally lower scores compared to their parent datasets suggest the context is a crucial component for performance on those tasks.
In essence, this chart is a tool for understanding task relatedness and predicting how a model trained for one purpose might fare in another, guiding decisions about multi-task learning, data selection, and model robustness.
DECODING INTELLIGENCE...