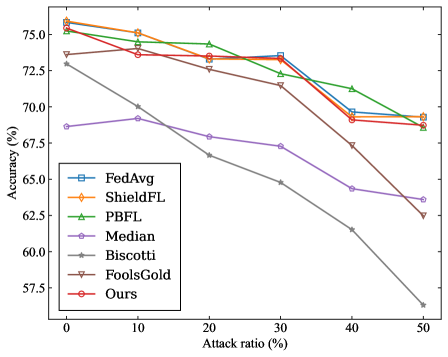
## Line Chart: Accuracy vs. Attack Ratio for Different Methods
### Overview
The image is a line chart comparing the accuracy of different methods (FedAvg, ShieldFL, PBFL, Median, Biscotti, FoolsGold, and Ours) against varying attack ratios. The x-axis represents the attack ratio (from 0% to 50%), and the y-axis represents the accuracy (from 57.5% to 75%). Each method is represented by a distinct colored line with a unique marker.
### Components/Axes
* **X-axis:** Attack ratio (%), with markers at 0, 10, 20, 30, 40, and 50.
* **Y-axis:** Accuracy (%), with markers at 57.5, 60.0, 62.5, 65.0, 67.5, 70.0, 72.5, and 75.0.
* **Legend (located in the lower-left):**
* Blue square: FedAvg
* Orange diamond: ShieldFL
* Green triangle: PBFL
* Purple circle: Median
* Gray star: Biscotti
* Brown inverted triangle: FoolsGold
* Red circle: Ours
### Detailed Analysis
* **FedAvg (Blue Square):** The accuracy starts at approximately 73.2% at 0% attack ratio. It remains relatively stable until 30% attack ratio (approximately 73.3%), then decreases to around 69.5% at 40% attack ratio, and ends at approximately 69.3% at 50% attack ratio.
* **ShieldFL (Orange Diamond):** The accuracy starts at approximately 75.2% at 0% attack ratio. It decreases slightly to approximately 74.8% at 10% attack ratio, then decreases to approximately 73.5% at 20% attack ratio, then decreases to approximately 72.8% at 30% attack ratio, then decreases to approximately 69.5% at 40% attack ratio, and ends at approximately 69.3% at 50% attack ratio.
* **PBFL (Green Triangle):** The accuracy starts at approximately 75.5% at 0% attack ratio. It decreases slightly to approximately 75.0% at 10% attack ratio, then decreases to approximately 73.5% at 20% attack ratio, then decreases to approximately 72.5% at 30% attack ratio, then decreases to approximately 69.5% at 40% attack ratio, and ends at approximately 69.5% at 50% attack ratio.
* **Median (Purple Circle):** The accuracy starts at approximately 68.7% at 0% attack ratio. It increases to approximately 69.5% at 10% attack ratio, then decreases to approximately 67.8% at 20% attack ratio, then decreases to approximately 67.2% at 30% attack ratio, then decreases to approximately 64.2% at 40% attack ratio, and ends at approximately 63.5% at 50% attack ratio.
* **Biscotti (Gray Star):** The accuracy starts at approximately 73.0% at 0% attack ratio. It decreases to approximately 70.0% at 10% attack ratio, then decreases to approximately 66.5% at 20% attack ratio, then decreases to approximately 64.8% at 30% attack ratio, then decreases to approximately 61.5% at 40% attack ratio, and ends at approximately 56.2% at 50% attack ratio.
* **FoolsGold (Brown Inverted Triangle):** The accuracy starts at approximately 75.5% at 0% attack ratio. It decreases slightly to approximately 74.0% at 10% attack ratio, then decreases to approximately 72.8% at 20% attack ratio, then decreases to approximately 72.5% at 30% attack ratio, then decreases to approximately 67.2% at 40% attack ratio, and ends at approximately 62.5% at 50% attack ratio.
* **Ours (Red Circle):** The accuracy starts at approximately 75.5% at 0% attack ratio. It decreases slightly to approximately 74.5% at 10% attack ratio, then decreases to approximately 73.5% at 20% attack ratio, then decreases to approximately 73.3% at 30% attack ratio, then decreases to approximately 69.5% at 40% attack ratio, and ends at approximately 69.3% at 50% attack ratio.
### Key Observations
* Biscotti shows the most significant decrease in accuracy as the attack ratio increases.
* FedAvg, ShieldFL, PBFL, and Ours methods maintain relatively stable accuracy up to a 30% attack ratio, after which they experience a slight decrease.
* FoolsGold and Median show a moderate decrease in accuracy as the attack ratio increases.
* At 0% attack ratio, most methods have high accuracy, ranging from 68.7% to 75.5%.
* At 50% attack ratio, the accuracy varies significantly among the methods, ranging from 56.2% to 69.5%.
### Interpretation
The chart illustrates the robustness of different methods against increasing attack ratios. Biscotti appears to be the most vulnerable to attacks, as its accuracy drops significantly. FedAvg, ShieldFL, PBFL, and "Ours" methods demonstrate better resilience, maintaining relatively stable accuracy even with higher attack ratios. The performance differences highlight the varying effectiveness of these methods in mitigating the impact of adversarial attacks. The data suggests that the choice of method is crucial in environments where the attack ratio is high, as it can significantly impact the accuracy of the system.