## Line Chart: Benchmark: AIME24
### Overview
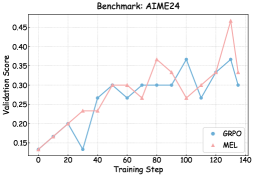
The image displays a line chart comparing the validation score performance of two methods, GRPO and MEL, over the course of training steps. The chart is titled "Benchmark: AIME24". The x-axis represents the progression of training, while the y-axis measures the validation score, a metric of model performance.
### Components/Axes
* **Chart Title:** "Benchmark: AIME24" (centered at the top).
* **X-Axis:**
* **Label:** "Training Step" (centered below the axis).
* **Scale:** Linear scale from 0 to 140.
* **Major Tick Marks:** 0, 20, 40, 60, 80, 100, 120, 140.
* **Y-Axis:**
* **Label:** "Validation Score" (rotated vertically on the left side).
* **Scale:** Linear scale from 0.15 to 0.45.
* **Major Tick Marks:** 0.15, 0.20, 0.25, 0.30, 0.35, 0.40, 0.45.
* **Legend:**
* **Position:** Top-right corner of the chart area.
* **Entries:**
1. **GRPO:** Represented by a blue line with circular markers.
2. **MEL:** Represented by a red line with circular markers.
* **Grid:** Light gray horizontal and vertical grid lines are present.
### Detailed Analysis
The chart plots two data series, each consisting of approximately 8 data points at the major x-axis intervals.
**1. GRPO (Blue Line) Trend & Data Points:**
* **Trend:** The GRPO line shows moderate volatility. It starts low, experiences a dip, rises to a plateau, and then fluctuates with a notable peak before a final rise.
* **Approximate Data Points (Training Step, Validation Score):**
* (0, ~0.15)
* (20, ~0.14) - *A dip from the starting point.*
* (40, ~0.30) - *A sharp increase.*
* (60, ~0.27) - *A slight decrease.*
* (80, ~0.30) - *Returns to the previous level.*
* (100, ~0.37) - *The peak for this series.*
* (120, ~0.27) - *A significant drop.*
* (140, ~0.36) - *A strong recovery.*
**2. MEL (Red Line) Trend & Data Points:**
* **Trend:** The MEL line shows a more pronounced upward trend with higher volatility, especially in the later stages. It generally outperforms GRPO after step 60, with a dramatic spike and subsequent correction.
* **Approximate Data Points (Training Step, Validation Score):**
* (0, ~0.15)
* (20, ~0.23) - *A steady initial increase.*
* (40, ~0.24) - *A very slight increase.*
* (60, ~0.30) - *A notable increase, matching GRPO.*
* (80, ~0.36) - *Continues to rise, surpassing GRPO.*
* (100, ~0.27) - *A sharp dip, falling below GRPO at this step.*
* (120, ~0.46) - *A dramatic spike to the highest point on the chart.*
* (140, ~0.31) - *A significant correction downward.*
### Key Observations
1. **Performance Crossover:** The two methods have similar performance at steps 0, 60, and 140. MEL leads at steps 20, 40, 80, and 120. GRPO leads only at step 100.
2. **Volatility:** Both methods show non-monotonic progress. MEL exhibits greater volatility, particularly the extreme spike at step 120 followed by a sharp drop.
3. **Peak Performance:** The single highest validation score (~0.46) is achieved by MEL at step 120. The peak for GRPO (~0.37) is lower and occurs at step 100.
4. **Final Convergence:** By the final recorded step (140), both methods converge to a similar score range (GRPO ~0.36, MEL ~0.31), though GRPO ends slightly higher.
### Interpretation
This chart benchmarks two training methodologies (GRPO and MEL) on the AIME24 task. The data suggests that while both methods can achieve comparable final performance, their learning trajectories differ significantly.
* **MEL** demonstrates a capacity for higher peak performance (as seen at step 120) but appears less stable, with its performance being more sensitive to specific training steps. The dramatic spike and drop could indicate an unstable optimization phase or a particularly effective but transient training configuration.
* **GRPO** shows a more stable, albeit slightly lower, performance profile. Its peak occurs earlier (step 100), and its fluctuations are less extreme. This might suggest a more robust but potentially slower or less ambitious optimization path.
The fact that neither line shows a smooth, consistently increasing trend is notable. It implies that the validation score for this benchmark is noisy or that the training process for both methods involves significant exploration, leading to temporary performance regressions. The final convergence suggests that given enough training steps, both methods may settle into a similar performance regime, but the path to get there—and the potential for short-term high performance—differs. For a practitioner, the choice between GRPO and MEL might depend on whether they prioritize stability (favoring GRPO) or are willing to tolerate volatility in pursuit of potentially higher short-term gains (favoring MEL).