## Line Graph: Benchmark: AIME24
### Overview
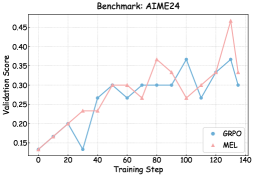
The image is a line graph comparing the validation performance of two models, **GRPO** (blue) and **MEL** (red), over 140 training steps on the AIME24 benchmark. The x-axis represents training steps (0–140), and the y-axis represents validation scores (0.15–0.45). Both lines exhibit fluctuating trends, with MEL achieving a higher peak validation score than GRPO.
---
### Components/Axes
- **Title**: "Benchmark: AIME24" (top center).
- **X-axis**: "Training Step" (0–140, increments of 20).
- **Y-axis**: "Validation Score" (0.15–0.45, increments of 0.05).
- **Legend**: Located at the bottom-right corner, with:
- **GRPO**: Blue line with circular markers.
- **MEL**: Red line with triangular markers.
---
### Detailed Analysis
#### GRPO (Blue Line)
- **Initial Trend**: Starts at ~0.13 (step 0), rises sharply to ~0.27 by step 40.
- **Mid-Training**: Fluctuates between ~0.27 and ~0.30 from steps 60–100.
- **Late Training**: Peaks at ~0.37 around step 100, then drops to ~0.30 by step 140.
- **Key Data Points**:
- Step 0: ~0.13
- Step 20: ~0.20
- Step 40: ~0.27
- Step 80: ~0.30
- Step 100: ~0.37
- Step 140: ~0.30
#### MEL (Red Line)
- **Initial Trend**: Starts at ~0.13 (step 0), rises gradually to ~0.24 by step 40.
- **Mid-Training**: Peaks at ~0.36 around step 80, then dips to ~0.27 by step 100.
- **Late Training**: Surges to ~0.46 around step 130, then declines to ~0.33 by step 140.
- **Key Data Points**:
- Step 0: ~0.13
- Step 20: ~0.20
- Step 40: ~0.24
- Step 80: ~0.36
- Step 100: ~0.27
- Step 130: ~0.46
- Step 140: ~0.33
---
### Key Observations
1. **Performance Divergence**: MEL outperforms GRPO in the final training steps, achieving a peak validation score of ~0.46 (step 130) vs. GRPO’s ~0.37 (step 100).
2. **Volatility**: Both lines show fluctuations, but MEL’s later-stage volatility is more pronounced (e.g., sharp drop from 0.46 to 0.33 between steps 130–140).
3. **Early-Stage Similarity**: Both models start with similar performance (~0.13 at step 0) but diverge after step 40.
---
### Interpretation
The graph suggests that **MEL** is more effective for the AIME24 benchmark in later training stages, potentially due to better optimization or architecture suited to the task. The sharp late-stage peak for MEL may indicate a "late bloomer" effect, where performance improves significantly after extensive training. However, the subsequent drop at step 140 could signal overfitting or instability. GRPO’s earlier peak and subsequent decline might reflect a trade-off between early gains and long-term stability. These trends highlight the importance of training duration and model selection for benchmark performance.