# Technical Data Extraction: Mean Accuracy Performance by Compression Method
This document provides a detailed extraction of the data presented in the bar chart comparing various model compression methods across four task categories.
## 1. Metadata and Axis Information
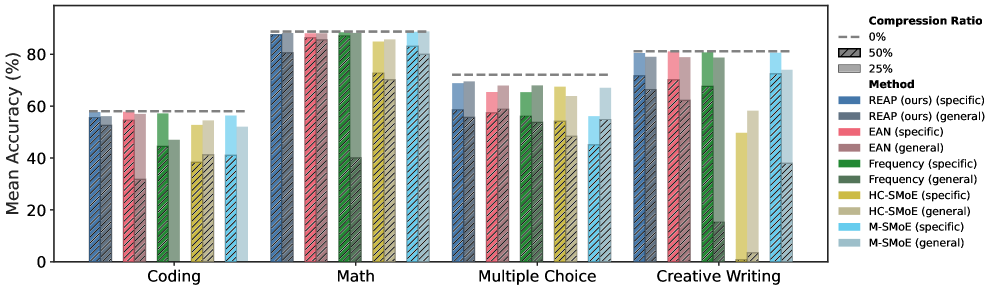
* **Y-Axis Title:** Mean Accuracy (%)
* **Y-Axis Scale:** 0 to 80+ (increments of 20 marked: 0, 20, 40, 60, 80)
* **X-Axis Categories (Tasks):**
1. Coding
2. Math
3. Multiple Choice
4. Creative Writing
* **Baseline:** A horizontal dashed grey line represents the **0% Compression Ratio** (uncompressed performance) for each task category.
## 2. Legend and Classification
The chart uses a combination of color (Method) and texture/shading (Compression Ratio) to display data.
### Compression Ratio (Texture/Shading)
* **0%:** Horizontal dashed grey line (Baseline).
* **50%:** Bars with diagonal hatching (forward slash pattern).
* **25%:** Solid colored bars (placed behind/above the 50% bars).
### Methods (Colors)
Each method is evaluated in two contexts: **(specific)** and **(general)**.
* **REAP (ours):** Blue (Specific: Medium Blue / General: Dark Grey-Blue)
* **EAN:** Red/Pink (Specific: Bright Pink / General: Dusty Rose)
* **Frequency:** Green (Specific: Kelly Green / General: Olive Green)
* **HC-SMoE:** Yellow/Tan (Specific: Gold / General: Beige)
* **M-SMoE:** Light Blue (Specific: Sky Blue / General: Pale Blue)
---
## 3. Data Extraction by Task Category
Values are estimated based on the Y-axis scale. Within each method group, the left bar is "(specific)" and the right bar is "(general)".
| Task Category | Baseline (0%) | Method | Specific (%) | General (%) |
| :--- | :--- | :--- | :--- | :--- |
| **Coding** | ~58% | REAP (ours) | ~56% | ~53% |
| | | EAN | ~55% | ~32% |
| | | Frequency | ~57% | ~47% |
| | | HC-SMoE | ~53% | ~54% |
| | | M-SMoE | ~56% | ~52% |
| **Math** | ~89% | REAP (ours) | ~88% | ~89% |
| | | EAN | ~87% | ~86% |
| | | Frequency | ~88% | ~89% |
| | | HC-SMoE | ~85% | ~86% |
| | | M-SMoE | ~89% | ~89% |
| **Multiple Choice** | ~72% | REAP (ours) | ~69% | ~70% |
| | | EAN | ~65% | ~68% |
| | | Frequency | ~65% | ~68% |
| | | HC-SMoE | ~67% | ~64% |
| | | M-SMoE | ~56% | ~67% |
| **Creative Writing** | ~81% | REAP (ours) | ~80% | ~79% |
| | | EAN | ~81% | ~79% |
| | | Frequency | ~81% | ~78% |
| | | HC-SMoE | ~50% | ~58% |
| | | M-SMoE | ~81% | ~74% |
---
## 4. Key Observations and Trends
* **REAP (ours):** Consistently maintains performance closest to the 0% baseline across all tasks and both specific/general contexts, showing high robustness to 50% compression (hatched areas).
* **Performance Degradation:**
* **Frequency (general)** and **HC-SMoE (specific)** show catastrophic failure in the "Creative Writing" task at 50% compression (dropping to ~15% and ~4% respectively).
* **EAN (general)** shows a significant performance drop in the "Coding" task at 50% compression.
* **Task Difficulty:** The "Math" category shows the highest overall accuracy and the least variance between compression methods, while "Coding" and "Creative Writing" show the highest sensitivity to different compression algorithms.