## Scatter Plot: Model Performance on Various Datasets
### Overview
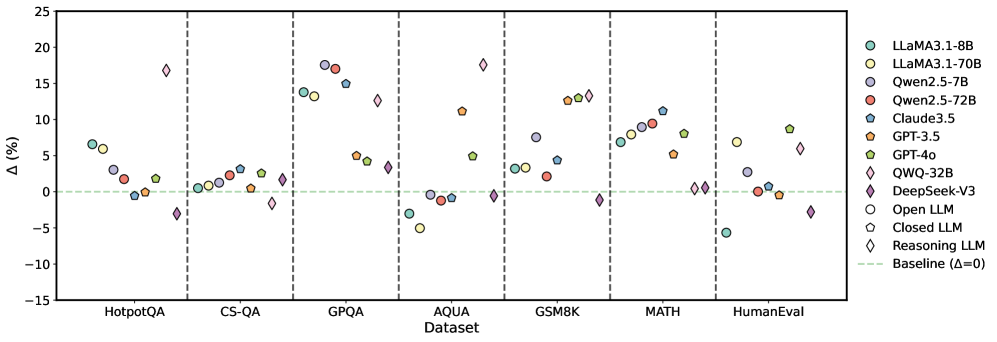
The image is a scatter plot comparing the performance (Delta %) of various Large Language Models (LLMs) on different datasets. The x-axis represents the dataset, and the y-axis represents the percentage difference (Delta %). Each model is represented by a unique color and marker. A horizontal dashed line indicates the baseline performance (Delta = 0).
### Components/Axes
* **X-axis:** "Dataset" with categories: HotpotQA, CS-QA, GPQA, AQUA, GSM8K, MATH, HumanEval.
* **Y-axis:** "Δ (%)" with a scale from -15 to 25, incrementing by 5.
* **Legend:** Located on the right side of the plot. It maps colors and markers to specific LLMs:
* Teal circle: LLaMA3.1-8B
* Yellow circle: LLaMA3.1-70B
* Purple circle: Qwen2.5-7B
* Red circle: Qwen2.5-72B
* Blue pentagon: Claude3.5
* Orange pentagon: GPT-3.5
* Green pentagon: GPT-4o
* Purple diamond: QWQ-32B
* Red diamond: DeepSeek-V3
* White circle: Open LLM
* White pentagon: Closed LLM
* White diamond: Reasoning LLM
* Light green dashed line: Baseline (Δ=0)
### Detailed Analysis
**HotpotQA:**
* LLaMA3.1-8B (Teal circle): ~6%
* LLaMA3.1-70B (Yellow circle): ~6%
* Qwen2.5-7B (Purple circle): ~1.5%
* Qwen2.5-72B (Red circle): ~1.5%
* Claude3.5 (Blue pentagon): ~-1%
* GPT-3.5 (Orange pentagon): ~2%
* GPT-4o (Green pentagon): ~2%
* QWQ-32B (Purple diamond): ~-3%
* DeepSeek-V3 (Red diamond): ~-3%
* Open LLM (White circle): ~1%
* Closed LLM (White pentagon): ~2%
* Reasoning LLM (White diamond): ~-3%
**CS-QA:**
* LLaMA3.1-8B (Teal circle): ~2%
* LLaMA3.1-70B (Yellow circle): ~2%
* Qwen2.5-7B (Purple circle): ~2%
* Qwen2.5-72B (Red circle): ~2%
* Claude3.5 (Blue pentagon): ~1%
* GPT-3.5 (Orange pentagon): ~2%
* GPT-4o (Green pentagon): ~2%
* QWQ-32B (Purple diamond): ~3%
* DeepSeek-V3 (Red diamond): ~-1%
* Open LLM (White circle): ~2%
* Closed LLM (White pentagon): ~2%
* Reasoning LLM (White diamond): ~-1%
**GPQA:**
* LLaMA3.1-8B (Teal circle): ~7%
* LLaMA3.1-70B (Yellow circle): ~17%
* Qwen2.5-7B (Purple circle): ~18%
* Qwen2.5-72B (Red circle): ~15%
* Claude3.5 (Blue pentagon): ~14%
* GPT-3.5 (Orange pentagon): ~5%
* GPT-4o (Green pentagon): ~5%
* QWQ-32B (Purple diamond): ~17%
* DeepSeek-V3 (Red diamond): ~-3%
* Open LLM (White circle): ~7%
* Closed LLM (White pentagon): ~15%
* Reasoning LLM (White diamond): ~17%
**AQUA:**
* LLaMA3.1-8B (Teal circle): ~-3%
* LLaMA3.1-70B (Yellow circle): ~-3%
* Qwen2.5-7B (Purple circle): ~-1%
* Qwen2.5-72B (Red circle): ~-1%
* Claude3.5 (Blue pentagon): ~-1%
* GPT-3.5 (Orange pentagon): ~11%
* GPT-4o (Green pentagon): ~5%
* QWQ-32B (Purple diamond): ~13%
* DeepSeek-V3 (Red diamond): ~-3%
* Open LLM (White circle): ~-3%
* Closed LLM (White pentagon): ~-1%
* Reasoning LLM (White diamond): ~13%
**GSM8K:**
* LLaMA3.1-8B (Teal circle): ~1%
* LLaMA3.1-70B (Yellow circle): ~13%
* Qwen2.5-7B (Purple circle): ~13%
* Qwen2.5-72B (Red circle): ~13%
* Claude3.5 (Blue pentagon): ~14%
* GPT-3.5 (Orange pentagon): ~11%
* GPT-4o (Green pentagon): ~11%
* QWQ-32B (Purple diamond): ~-2%
* DeepSeek-V3 (Red diamond): ~-2%
* Open LLM (White circle): ~1%
* Closed LLM (White pentagon): ~11%
* Reasoning LLM (White diamond): ~-2%
**MATH:**
* LLaMA3.1-8B (Teal circle): ~8%
* LLaMA3.1-70B (Yellow circle): ~10%
* Qwen2.5-7B (Purple circle): ~11%
* Qwen2.5-72B (Red circle): ~9%
* Claude3.5 (Blue pentagon): ~11%
* GPT-3.5 (Orange pentagon): ~6%
* GPT-4o (Green pentagon): ~7%
* QWQ-32B (Purple diamond): ~1%
* DeepSeek-V3 (Red diamond): ~1%
* Open LLM (White circle): ~8%
* Closed LLM (White pentagon): ~9%
* Reasoning LLM (White diamond): ~1%
**HumanEval:**
* LLaMA3.1-8B (Teal circle): ~-6%
* LLaMA3.1-70B (Yellow circle): ~7%
* Qwen2.5-7B (Purple circle): ~7%
* Qwen2.5-72B (Red circle): ~7%
* Claude3.5 (Blue pentagon): ~7%
* GPT-3.5 (Orange pentagon): ~1%
* GPT-4o (Green pentagon): ~1%
* QWQ-32B (Purple diamond): ~7%
* DeepSeek-V3 (Red diamond): ~-1%
* Open LLM (White circle): ~-6%
* Closed LLM (White pentagon): ~1%
* Reasoning LLM (White diamond): ~7%
### Key Observations
* The performance of different LLMs varies significantly across different datasets.
* Some models (e.g., LLaMA3.1-70B, Qwen2.5-7B, Qwen2.5-72B, Claude3.5) generally perform well on GPQA, GSM8K, and MATH datasets.
* Models like QWQ-32B and DeepSeek-V3 show relatively lower performance on several datasets, sometimes even below the baseline.
* The "Reasoning LLM" category (white diamond) shows high variance, with strong performance on GPQA, AQUA, GSM8K, and HumanEval, but weaker performance on HotpotQA, CS-QA, and MATH.
### Interpretation
The scatter plot provides a comparative analysis of LLM performance across various question-answering and reasoning datasets. The data suggests that no single model consistently outperforms all others across all tasks. The choice of the "best" model depends heavily on the specific dataset and the type of reasoning or knowledge required. The plot highlights the strengths and weaknesses of each model, which can inform model selection for specific applications. The "Reasoning LLM" category's high variance suggests that this type of model may be highly specialized, excelling in some reasoning tasks but struggling in others. The baseline (Δ=0) serves as a reference point to quickly identify models that perform above or below average on each dataset.