## Scatter Plot with Trend Line: Brain Alignment vs. Initialization Standard Deviation
### Overview
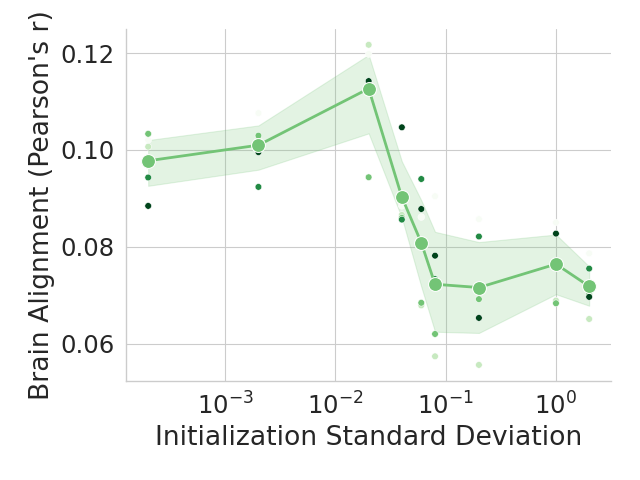
The image is a scientific scatter plot with an overlaid trend line and confidence interval. It visualizes the relationship between the standard deviation used for initializing a model's parameters (x-axis) and the resulting "Brain Alignment," measured as Pearson's correlation coefficient (y-axis). The data suggests an optimal range for initialization that maximizes alignment with brain data.
### Components/Axes
* **Chart Type:** Scatter plot with a smoothed mean trend line and a shaded confidence interval.
* **X-Axis:**
* **Label:** `Initialization Standard Deviation`
* **Scale:** Logarithmic (base 10).
* **Major Tick Marks:** `10^-3`, `10^-2`, `10^-1`, `10^0` (which is 1).
* **Y-Axis:**
* **Label:** `Brain Alignment (Pearson's r)`
* **Scale:** Linear.
* **Range:** Approximately 0.055 to 0.125.
* **Major Tick Marks:** `0.06`, `0.08`, `0.10`, `0.12`.
* **Legend:**
* **Position:** Top-right corner of the plot area.
* **Entry 1:** A solid green line labeled `Mean`. This represents the average trend across multiple experimental runs.
* **Entry 2:** A small, dark green dot labeled `Individual runs`. These represent the data points from single experimental runs.
* **Data Series:**
1. **Individual Runs (Scatter Points):** Numerous small dots in varying shades of green (from dark forest green to light sage green) are scattered across the plot. Each dot represents a single experiment's result at a specific initialization standard deviation.
2. **Mean Trend Line:** A thick, solid green line that traces the average brain alignment across the range of initialization values.
3. **Confidence Interval:** A semi-transparent, light green shaded region surrounding the mean trend line, indicating the variability or uncertainty around the mean (likely standard deviation or standard error).
### Detailed Analysis
* **Trend Description:** The mean trend line (green) shows a clear non-monotonic relationship. It slopes upward from left to right, peaks, and then slopes downward.
* **Data Point Extraction (Approximate):**
* **At Init. Std. Dev. ~ 10^-3 (0.001):** Mean alignment is ~0.098. Individual runs cluster between ~0.088 and ~0.103.
* **At Init. Std. Dev. ~ 10^-2 (0.01):** This is the peak region. The mean alignment reaches its maximum of approximately **0.112**. Individual runs show high variability here, ranging from ~0.095 to a high outlier near ~0.122.
* **At Init. Std. Dev. ~ 10^-1 (0.1):** The mean alignment has dropped significantly to ~0.072. Individual runs are scattered between ~0.058 and ~0.082.
* **At Init. Std. Dev. ~ 10^0 (1.0):** The mean alignment is approximately 0.077, showing a slight recovery from the low at 0.1 but still far below the peak. Individual runs range from ~0.068 to ~0.083.
* **Confidence Interval Width:** The shaded green band is narrowest around the peak (10^-2) and widens considerably on the descending slope (between 10^-2 and 10^-1), indicating greater variance in outcomes in that region.
### Key Observations
1. **Optimal Initialization Range:** There is a distinct peak in brain alignment when the initialization standard deviation is around **0.01 (10^-2)**.
2. **Performance Degradation:** Initializing with values either too small (< 0.005) or too large (> 0.05) leads to substantially lower alignment scores.
3. **High Variance at Peak:** The highest mean performance coincides with the greatest spread in individual run results, suggesting the outcome is sensitive to other factors in this optimal range.
4. **Logarithmic Relationship:** The use of a log scale on the x-axis indicates the effect spans orders of magnitude, and the optimal value is not at an extreme but in a middle range.
### Interpretation
This chart demonstrates a critical hyperparameter tuning result for a computational neuroscience or AI alignment study. The "Brain Alignment" metric likely quantifies how well a neural network's internal representations correlate with activity patterns recorded from a biological brain.
The data suggests that **moderate initialization noise (std. dev. ~0.01) is optimal** for developing brain-like representations. Very small initialization (near-zero std. dev.) may lead to symmetric or saturated starting points that hinder learning of complex, brain-like features. Conversely, very large initialization (std. dev. ~1.0) likely creates chaotic initial activations that are difficult to train into a coherent, biologically plausible state.
The Peircean insight here is that the relationship is not linear but follows an **inverted-U shape**, a common pattern in complex systems where an intermediate level of a parameter (here, randomness/noise) maximizes a desired outcome (alignment). The chart provides actionable guidance: to replicate or achieve high brain alignment, one should initialize model parameters with a Gaussian distribution having a standard deviation close to 0.01. The wide confidence interval at the peak also warns that while this setting gives the best *average* result, individual training runs may vary significantly.