\n
## Chart: EW K-factor vs. √s
### Overview
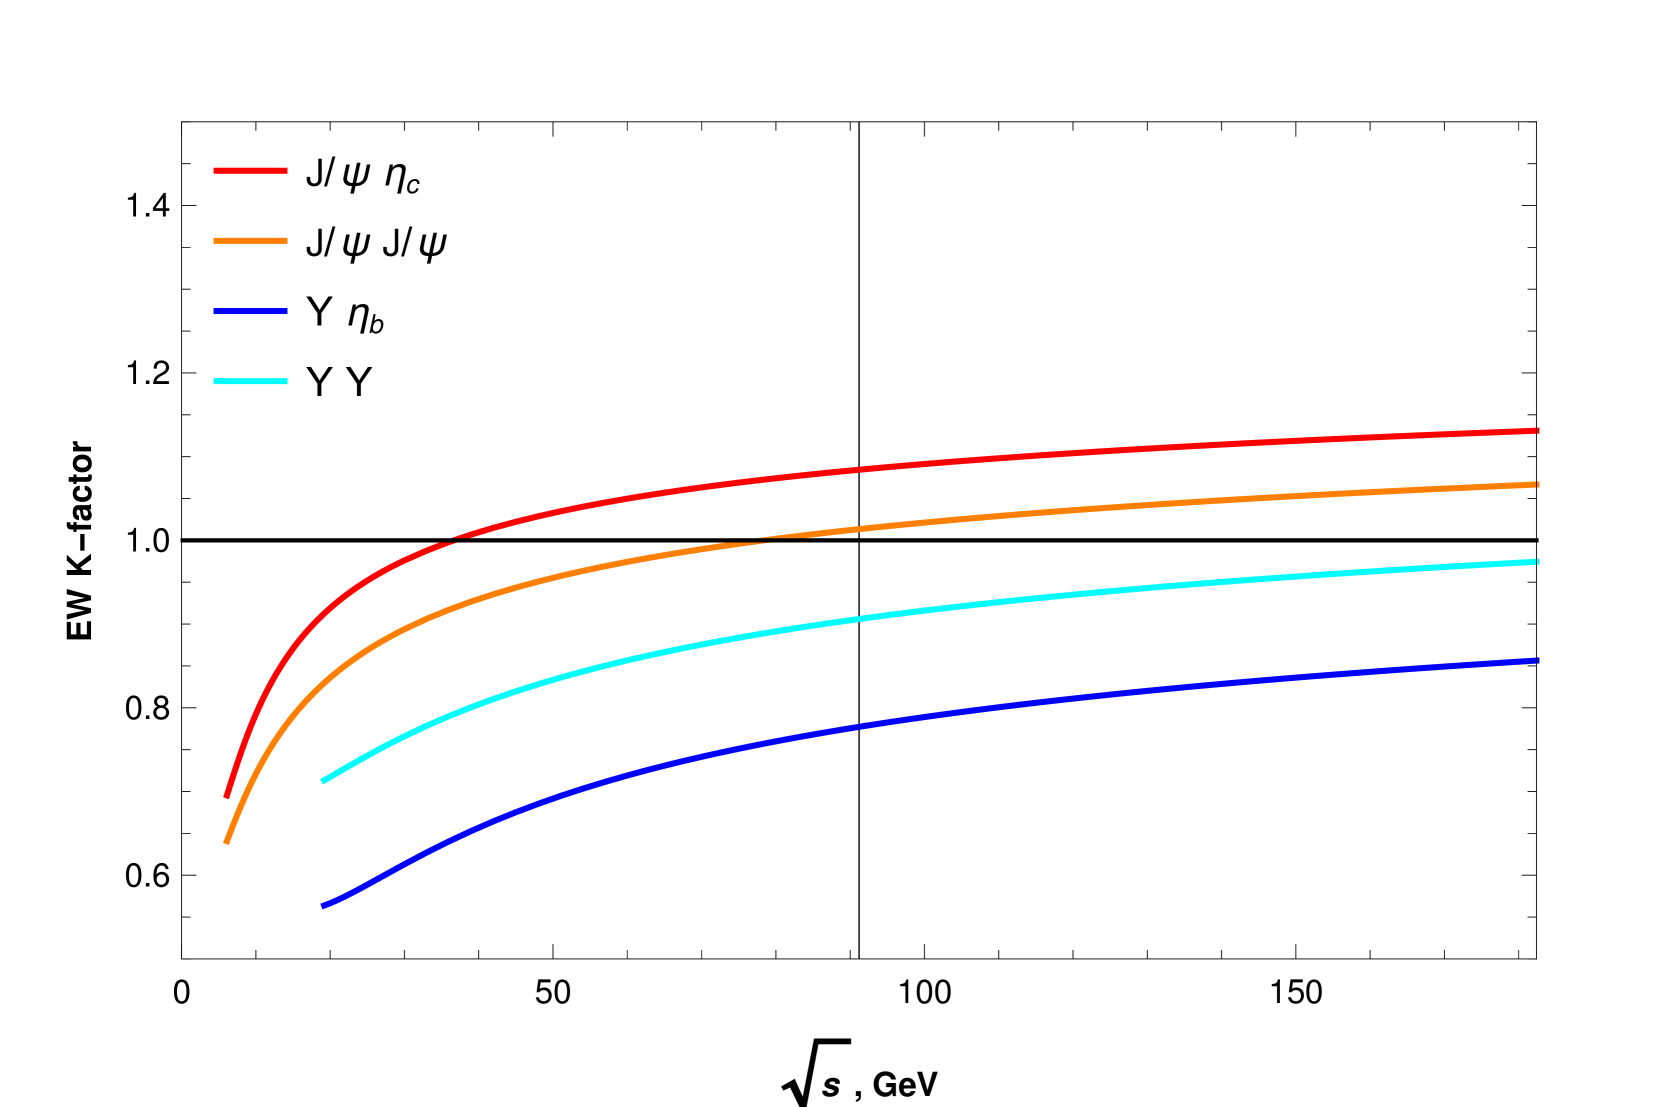
The image presents a line chart illustrating the Electroweak (EW) K-factor as a function of the square root of the center-of-mass energy (√s) in GeV. The chart displays four different curves, each representing a specific particle interaction.
### Components/Axes
* **X-axis:** √s, GeV (Square root of the center-of-mass energy in GeV). Scale ranges from 0 to 180, with tick marks at 0, 50, 100, 150.
* **Y-axis:** EW K-factor. Scale ranges from 0.6 to 1.4, with tick marks at 0.6, 0.8, 1.0, 1.2, 1.4.
* **Legend:** Located in the top-right corner. Contains the following labels and corresponding colors:
* J/ψ ηc (Red)
* J/ψ J/ψ (Orange)
* γ ηb (Blue)
* γ γ (Cyan)
### Detailed Analysis
The chart shows four curves, each representing the EW K-factor for a different particle interaction as a function of √s.
* **J/ψ ηc (Red):** This line starts at approximately 1.35 at √s = 0 GeV and decreases rapidly to around 0.95 at √s = 20 GeV. It then plateaus, approaching a value of approximately 1.05 at √s = 150 GeV. The line exhibits a strong initial decline followed by stabilization.
* **J/ψ J/ψ (Orange):** This line begins at approximately 1.1 at √s = 0 GeV and decreases to around 0.9 at √s = 20 GeV. It then gradually increases, reaching approximately 1.0 at √s = 100 GeV and remaining relatively constant at around 1.02 at √s = 150 GeV. The line shows a moderate initial decline and a subsequent slow increase.
* **γ ηb (Blue):** This line starts at approximately 0.65 at √s = 0 GeV and increases steadily, reaching approximately 0.85 at √s = 100 GeV and continuing to rise to around 0.9 at √s = 150 GeV. The line demonstrates a consistent upward trend.
* **γ γ (Cyan):** This line begins at approximately 0.8 at √s = 0 GeV and increases slowly, reaching approximately 0.9 at √s = 50 GeV and remaining relatively constant at around 0.92 at √s = 150 GeV. The line shows a gradual increase followed by stabilization.
### Key Observations
* All four curves converge towards a K-factor of approximately 1.0 as √s increases.
* The J/ψ ηc interaction has the highest K-factor at low energies (√s < 50 GeV).
* The γ ηb interaction has the lowest K-factor at low energies (√s < 50 GeV).
* The γ γ interaction exhibits the most stable K-factor across the entire energy range.
### Interpretation
The chart illustrates how electroweak corrections (represented by the K-factor) affect different particle interactions at varying energy scales. The K-factor quantifies the ratio of the full electroweak calculation to the leading-order approximation. As the center-of-mass energy increases, the electroweak corrections become less significant, and the K-factors approach 1.0 for all interactions. This suggests that at high energies, the electroweak effects are less pronounced.
The differences in K-factor values between the interactions indicate that electroweak corrections are more important for some processes than others. The J/ψ ηc interaction, for example, experiences a more substantial correction at lower energies compared to the γ γ interaction. This could be due to the different masses and couplings of the involved particles.
The convergence of the K-factors at high energies is consistent with the expectation that electroweak effects become less important as the energy scale increases, and the interactions become more dominated by strong interactions. The chart provides valuable insights into the energy dependence of electroweak corrections in particle physics.