## Diagram: Reinforcement Learning Training and Verification Process
### Overview
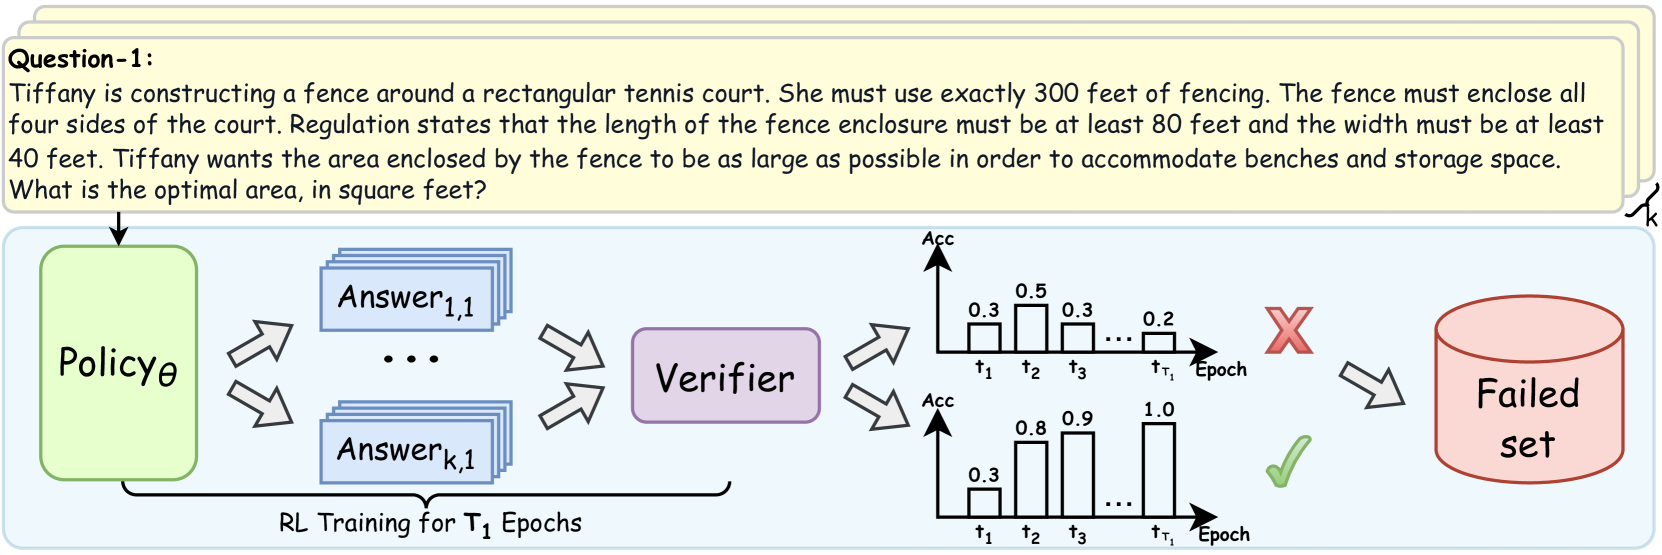
This diagram illustrates a reinforcement learning (RL) training process with a verification step. It depicts the flow of information from a Policy to a set of Answers, then to a Verifier, and finally to a categorization of success (Failed set) or continuation. The diagram also includes two bar charts representing the accuracy (Acc) of the verifier over time (Epochs).
### Components/Axes
The diagram consists of the following components:
* **Policy θ:** A green box representing the RL policy.
* **Answer 1,1 ... Answer k,1:** A gray box containing multiple answers generated by the policy.
* **Verifier:** A light blue box representing the verification process.
* **Failed set:** A red oval representing the set of failed answers.
* **Bar Charts (2):** Two bar charts showing accuracy (Acc) over time (τ1, τ2, τ3, τr, Epoch).
* **Text:** "RL Training for T1 Epochs" below the Answer box.
* **Question-1:** A text block at the top left describing a geometry problem.
The bar charts have a vertical axis labeled "Acc" (Accuracy) with a scale ranging from approximately 0.0 to 1.0. The horizontal axis represents time steps: τ1, τ2, τ3, τr, and Epoch.
### Detailed Analysis or Content Details
The diagram shows a flow of information:
1. The **Policy θ** generates multiple **Answers** (Answer 1,1 to Answer k,1). The arrows indicate a many-to-many relationship.
2. These **Answers** are fed into the **Verifier**.
3. The **Verifier** evaluates the answers and categorizes them.
4. If the answers are deemed incorrect, they are added to the **Failed set**.
5. The **Verifier's** accuracy is visualized using two bar charts.
**Bar Chart 1 (Top):**
* τ1: Accuracy ≈ 0.3
* τ2: Accuracy ≈ 0.3
* τ3: Accuracy ≈ 0.3
* τr: Accuracy ≈ 0.2
* Epoch: Accuracy ≈ 0.5
The trend in this chart is relatively flat, with accuracy fluctuating around 0.3, and a slight increase to 0.5 at the Epoch.
**Bar Chart 2 (Bottom):**
* τ1: Accuracy ≈ 0.3
* τ2: Accuracy ≈ 0.9
* τ3: Accuracy ≈ 1.0
* τr: Accuracy ≈ 0.8
* Epoch: Accuracy ≈ 1.0
This chart shows a clear upward trend in accuracy, starting at 0.3, rising to 0.9, 1.0, 0.8, and peaking at 1.0 at the Epoch.
The text "RL Training for T1 Epochs" indicates that the process is repeated for T1 epochs.
The question at the top left is: "Tiffany is constructing a fence around a rectangular tennis court. She must use exactly 300 feet of fencing. The fence must enclose all four sides of the court. Regulation states that the length of the fence enclosure must be at least 80 feet and the width must be at least 40 feet. Tiffany wants the area enclosed by the fence to be as large as possible in order to accommodate benches and storage space. What is the optimal area, in square feet?"
### Key Observations
* The two bar charts demonstrate different accuracy trends. The first chart shows a relatively stable, lower accuracy, while the second chart shows a significant improvement in accuracy over time.
* The "Failed set" indicates that the RL policy is not always generating correct answers.
* The diagram highlights the importance of a verification step in RL training.
### Interpretation
The diagram illustrates a typical reinforcement learning workflow where a policy generates actions (answers), and a verifier assesses their quality. The two bar charts likely represent the accuracy of different verification methods or different stages of the verification process. The first chart might represent an initial, less refined verification method, while the second chart represents a more accurate and improved method. The increasing accuracy in the second chart suggests that the verification process is learning and improving over time. The failed set indicates that the policy is still making errors, and further training is needed. The inclusion of a geometry problem suggests that the RL agent is being trained to solve mathematical problems. The diagram emphasizes the iterative nature of RL training, where the policy is continuously refined based on feedback from the verifier.