\n
## Diagram: Reinforcement Learning Training Pipeline with Verification
### Overview
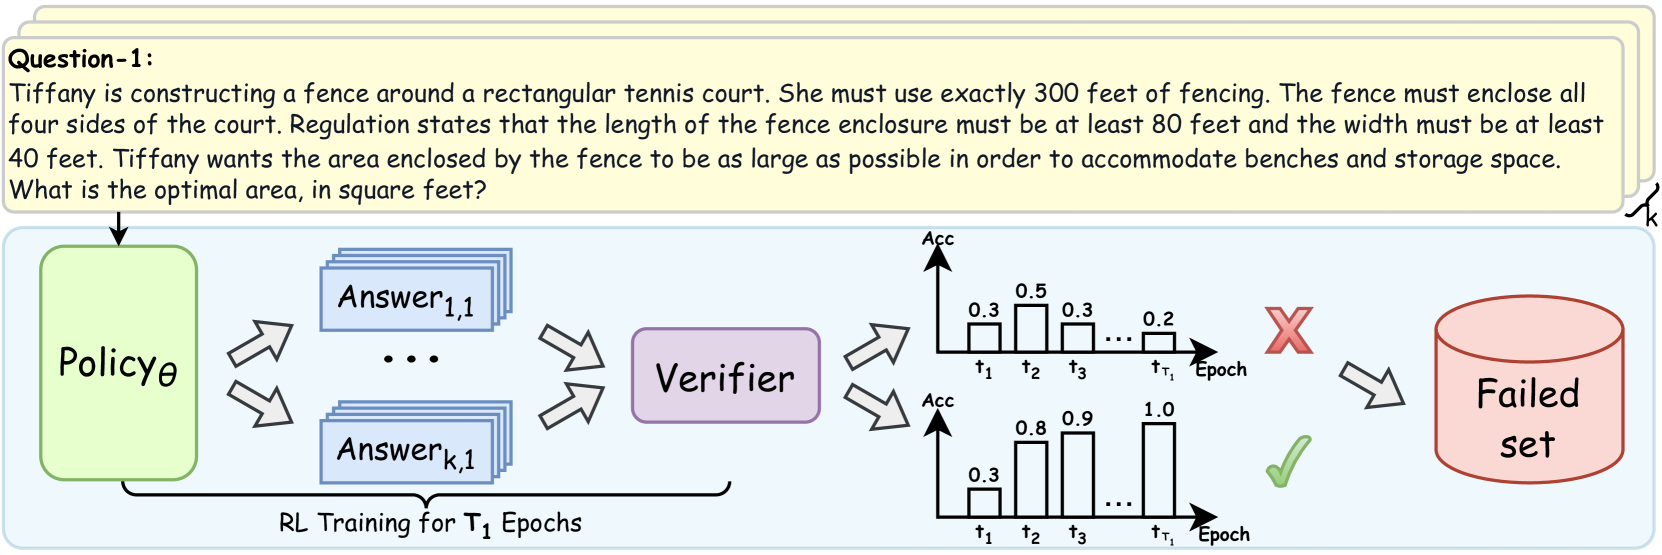
The image is a technical diagram illustrating a reinforcement learning (RL) training pipeline that incorporates a verification step. It consists of two main parts: a sample problem statement at the top and a flowchart below depicting the training and evaluation process. The diagram shows how a policy model generates multiple candidate answers, which are then evaluated by a verifier. The outcomes are visualized as accuracy trends over training epochs, leading to either a success path or a "Failed set."
### Components/Axes
**1. Problem Statement (Top Yellow Box):**
* **Label:** `Question-1:`
* **Text Content:** "Tiffany is constructing a fence around a rectangular tennis court. She must use exactly 300 feet of fencing. The fence must enclose all four sides of the court. Regulation states that the length of the fence enclosure must be at least 80 feet and the width must be at least 40 feet. Tiffany wants the area enclosed by the fence to be as large as possible in order to accommodate benches and storage space. What is the optimal area, in square feet?"
**2. Flowchart Components (Left to Right):**
* **Policyθ:** A green, rounded rectangle on the far left. It represents the policy model being trained.
* **Answer Generation:** Multiple blue, stacked rectangles labeled `Answer1,1` through `Answerk,1`, with ellipsis (`...`) indicating a sequence. This represents the generation of `k` candidate answers for a given input.
* **Verifier:** A purple, rounded rectangle positioned to the right of the answer blocks.
* **Accuracy Charts:** Two bar charts stacked vertically to the right of the Verifier.
* **Y-axis (Both Charts):** Labeled `Acc` (Accuracy).
* **X-axis (Both Charts):** Labeled `Epoch`, with markers `t1`, `t2`, `t3`, `...`, `tT1`.
* **Top Chart (Failure Path):** Shows bars with approximate heights: `0.3` at `t1`, `0.5` at `t2`, `0.3` at `t3`, and `0.2` at `tT1`. A large red **X** is placed to its right.
* **Bottom Chart (Success Path):** Shows bars with approximate heights: `0.3` at `t1`, `0.8` at `t2`, `0.9` at `t3`, and `1.0` at `tT1`. A green checkmark (✓) is placed to its right.
* **Failed Set:** A red cylinder on the far right, labeled `Failed set`.
* **Process Label:** Text below the Answer blocks reads `RL Training for T1 Epochs`.
**3. Flow Arrows:**
* An arrow points from the Problem Statement to `Policyθ`.
* Two diverging arrows point from `Policyθ` to the stack of `Answer` blocks.
* Two converging arrows point from the `Answer` blocks to the `Verifier`.
* Two diverging arrows point from the `Verifier` to the two accuracy charts.
* An arrow points from the red **X** (top chart) to the `Failed set`.
* A curved arrow points from the `Failed set` back to the `Policyθ` box, indicating a feedback loop.
### Detailed Analysis
The diagram details a closed-loop RL training process:
1. **Input:** A problem (exemplified by the tennis court fencing question) is fed into the policy model (`Policyθ`).
2. **Generation:** The policy generates `k` distinct candidate answers (`Answer1,1` to `Answerk,1`) for the given problem.
3. **Verification:** All generated answers are passed to a `Verifier` module, which evaluates their correctness or quality.
4. **Outcome Visualization:** The verification results are aggregated into accuracy (`Acc`) scores tracked over `T1` training epochs (`t1` to `tT1`). The diagram contrasts two possible trajectories:
* **Failure Trajectory (Top Chart):** Accuracy fluctuates at a low level (peaking at 0.5) and ends low (0.2). This path is marked with a red **X** and leads to the `Failed set`.
* **Success Trajectory (Bottom Chart):** Accuracy shows a clear, monotonic increasing trend from 0.3 to a perfect 1.0. This path is marked with a green checkmark.
5. **Feedback:** The `Failed set` (containing problems/answers that led to failure) is fed back into the `Policyθ`, presumably to inform and improve future training iterations.
### Key Observations
* **Contrasting Trends:** The core visual message is the stark contrast between the failing accuracy trend (non-monotonic, low final value) and the successful trend (smooth, monotonic increase to perfection).
* **Spatial Grounding:** The legend (red **X** and green checkmark) is placed immediately to the right of its corresponding chart, creating a clear visual association. The `Failed set` cylinder is positioned in the top-right quadrant, receiving input only from the failure path.
* **Process Scope:** The label `RL Training for T1 Epochs` brackets the answer generation and verification steps, indicating this entire subprocess occurs within each of the `T1` epochs.
* **Problem as Example:** The specific math problem at the top serves as a concrete example of the type of task the policy is being trained to solve. It is an optimization problem with constraints, requiring multi-step reasoning.
### Interpretation
This diagram illustrates a **verification-guided reinforcement learning** framework. The key insight is that raw answer generation is insufficient; a verifier is critical for providing a learning signal. The diverging accuracy trends demonstrate the framework's goal: to steer the policy away from answer patterns that lead to low, unstable verification scores (the failure path) and towards patterns that yield consistently improving and ultimately perfect scores (the success path).
The inclusion of the `Failed set` and its feedback loop is particularly significant. It suggests an **experience replay** or **hard negative mining** mechanism, where difficult examples that caused failure are specifically revisited to make the policy more robust. The specific math problem, with its precise constraints, exemplifies the kind of complex, verifiable task this system is designed to master. The diagram argues that for such tasks, integrating an explicit verifier into the RL loop is essential for achieving reliable, high-performance learning.