\n
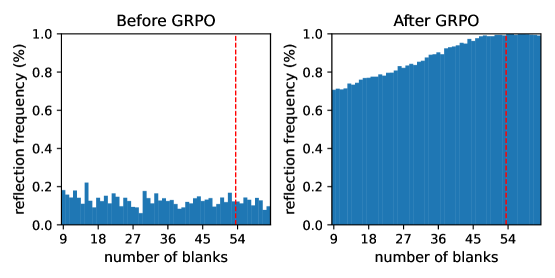
## Histograms: Reflection Frequency vs. Number of Blanks
### Overview
The image presents two histograms comparing the distribution of "reflection frequency" against the "number of blanks" before and after a process labeled "GRPO". Both histograms share the same x and y axes scales. A vertical dashed line is present in both histograms, marking a value of approximately 54 on the x-axis.
### Components/Axes
* **X-axis Label:** "number of blanks" (ranging from approximately 9 to 54)
* **Y-axis Label:** "reflection frequency (%)" (ranging from 0.0 to 1.0)
* **Title (Left Histogram):** "Before GRPO"
* **Title (Right Histogram):** "After GRPO"
* **Vertical Dashed Line:** Present in both histograms, positioned at approximately x = 54.
### Detailed Analysis or Content Details
**Left Histogram (Before GRPO):**
* The histogram shows a relatively flat distribution with many small peaks.
* The reflection frequency is generally low, mostly below 0.2.
* There is a slight increase in frequency around the x-axis value of 9, peaking at approximately 0.22.
* The frequency remains relatively constant between approximately 18 and 45, hovering around 0.1 to 0.15.
* There is a small peak around x=27 at approximately 0.2.
* The dashed line at x=54 does not correspond to a significant peak in the distribution.
**Right Histogram (After GRPO):**
* The histogram shows a monotonically increasing distribution.
* The reflection frequency starts near 0 at x=9 and increases steadily to approximately 1.0 at x=54.
* The frequency is approximately 0.2 at x=18.
* The frequency is approximately 0.4 at x=27.
* The frequency is approximately 0.6 at x=36.
* The frequency is approximately 0.8 at x=45.
* The dashed line at x=54 corresponds to a frequency of approximately 1.0.
### Key Observations
* The distribution of reflection frequency changes dramatically after the GRPO process.
* Before GRPO, the reflection frequency is low and relatively constant across most of the "number of blanks" range.
* After GRPO, the reflection frequency increases consistently with the "number of blanks".
* The dashed line at x=54 appears to mark a threshold or significant point in the "number of blanks" for the "After GRPO" distribution.
### Interpretation
The data suggests that the GRPO process significantly improves the relationship between the "number of blanks" and the "reflection frequency". Before GRPO, there is little correlation between these two variables. After GRPO, a strong positive correlation emerges: as the "number of blanks" increases, the "reflection frequency" also increases. The dashed line at x=54 might represent a saturation point, where further increases in the "number of blanks" do not lead to significant increases in "reflection frequency". The GRPO process appears to have transformed a random or noisy distribution into a predictable and increasing trend. The nature of "blanks" and "reflection frequency" is not provided, but the data suggests GRPO is a successful intervention.