## Bar Charts: Reflection Frequency Before and After GRPO
### Overview
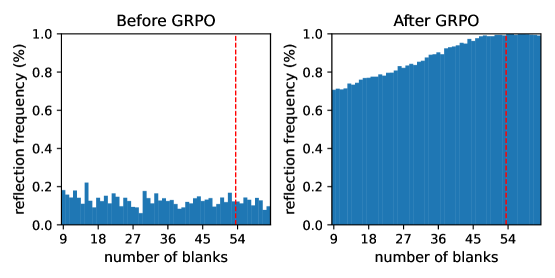
The image displays two side-by-side bar charts comparing "reflection frequency (%)" against the "number of blanks" before and after a process labeled "GRPO." The charts illustrate a dramatic shift in the distribution and magnitude of reflection frequency following the GRPO intervention.
### Components/Axes
* **Chart Titles:** "Before GRPO" (left chart), "After GRPO" (right chart).
* **Y-Axis (Both Charts):** Labeled "reflection frequency (%)". The scale runs from 0.0 to 1.0, with major tick marks at 0.0, 0.2, 0.4, 0.6, 0.8, and 1.0.
* **X-Axis (Both Charts):** Labeled "number of blanks". The scale shows major tick marks at 9, 18, 27, 36, 45, and 54.
* **Data Series:** Both charts use vertical blue bars to represent the frequency for each discrete "number of blanks" value.
* **Reference Line:** A vertical red dashed line is present in both charts at the x-axis value of 54.
### Detailed Analysis
**1. Before GRPO Chart (Left):**
* **Trend:** The reflection frequency is consistently low across all numbers of blanks, showing minor, non-systematic fluctuations. There is no clear upward or downward trend.
* **Data Points (Approximate):** Frequencies are predominantly below 0.2 (20%). The highest bar appears near x=18, reaching approximately 0.22. Most other bars cluster between 0.05 and 0.18. The frequency at the red dashed line (x=54) is approximately 0.15.
**2. After GRPO Chart (Right):**
* **Trend:** There is a strong, consistent, and nearly linear upward trend. Reflection frequency increases steadily as the number of blanks increases.
* **Data Points (Approximate):** The series starts at approximately 0.7 (70%) for x=9. It climbs steadily, crossing 0.8 around x=27, 0.9 around x=40, and reaching 1.0 (100%) at the red dashed line (x=54). The bars form a smooth, ascending staircase pattern.
### Key Observations
1. **Magnitude Shift:** The most striking observation is the massive increase in overall reflection frequency after GRPO. The lowest frequency after GRPO (~0.7) is more than three times higher than the highest frequency before GRPO (~0.22).
2. **Trend Transformation:** GRPO changes the relationship between the variables from a flat, noisy distribution to a strong, positive linear correlation.
3. **Threshold Achievement:** The red dashed line at 54 blanks marks a critical threshold. Before GRPO, this point shows low frequency (~15%). After GRPO, this is the point where reflection frequency achieves the maximum value of 100%.
4. **Consistency:** The "After GRPO" data shows remarkably low variance from its upward trend line, suggesting a highly predictable and controlled outcome.
### Interpretation
The data demonstrates that the GRPO process has a profound and systematic effect on the measured "reflection frequency." Before GRPO, the system exhibits low and erratic reflection behavior regardless of the input size (number of blanks). After GRPO, reflection becomes not only much more frequent but also scales directly and predictably with the complexity or size of the input.
The red line at 54 blanks likely represents a target or maximum input size. The charts show that GRPO enables the system to achieve perfect reflection (100% frequency) at this target size, whereas it failed to do so previously. This suggests GRPO is an effective optimization or training method for enhancing a reflective capability in a system, making its performance both stronger and more reliable as task demands increase. The near-perfect linearity after GRPO implies the process instills a consistent, rule-based response pattern.