## Flowchart: System Process Diagram
### Overview
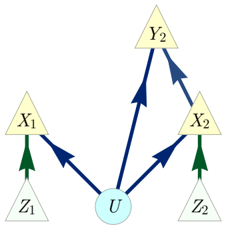
The image depicts a flowchart with six nodes (X1, X2, Y2, Z1, Z2, U) and directional arrows. Arrows are color-coded (blue, green, dark blue) to indicate relationships or processes. The central node **U** acts as a hub connecting to other nodes.
### Components/Axes
- **Nodes**:
- **X1**, **X2**: Intermediate nodes connected to **U** via blue arrows.
- **Y2**: Node connected to **X2** via a dark blue arrow.
- **Z1**, **Z2**: Terminal nodes connected to **X1** and **X2** via green arrows, respectively.
- **U**: Central node with bidirectional blue arrows to **X1** and **X2**.
- **Arrows**:
- **Blue**: Connect **U** to **X1**/**X2** (bidirectional).
- **Green**: Connect **X1** to **Z1** and **X2** to **Z2** (unidirectional).
- **Dark Blue**: Connect **Y2** to **X2** (unidirectional).
- **No explicit legend**: Colors are embedded in the diagram without a separate key.
### Detailed Analysis
- **Node U**: Central hub with bidirectional influence over **X1** and **X2**.
- **X1**: Receives input from **U** and outputs to **Z1** via green arrow.
- **X2**: Receives input from **U** and **Y2**, outputs to **Z2** via green arrow.
- **Y2**: External input to **X2** via dark blue arrow, suggesting a secondary influence.
- **Z1/Z2**: Terminal nodes with no outgoing arrows, indicating final outputs.
### Key Observations
1. **Centralized Control**: **U** governs the initial flow to **X1** and **X2**, implying a primary decision point.
2. **Divergent Paths**: **X1** and **X2** split into separate terminal nodes (**Z1**, **Z2**), suggesting parallel processes.
3. **Feedback Loop**: **Y2**’s connection to **X2** introduces an external input, potentially modifying the output to **Z2**.
4. **Color Coding**: Blue arrows (core connections), green arrows (outputs), and dark blue arrows (external inputs) differentiate relationship types.
### Interpretation
The flowchart likely represents a system where **U** initiates processes that branch into **X1** and **X2**. These nodes then produce outputs (**Z1**, **Z2**), with **Y2** acting as an external modifier to **X2**. The use of color coding emphasizes the hierarchy of relationships:
- **Blue** = Core bidirectional interactions (e.g., feedback between **U** and **X1/X2**).
- **Green** = Terminal outputs (no further processing).
- **Dark Blue** = External influence (e.g., **Y2** affecting **X2**).
This structure could model decision trees, data flow in software, or cause-effect relationships in a technical system. The absence of numerical data suggests a conceptual rather than quantitative representation.