## Diagram: Causal Diagram with Latent Variables
### Overview
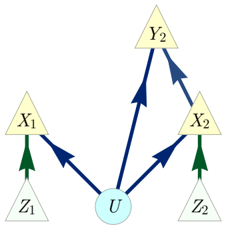
The image presents a causal diagram illustrating relationships between variables, some of which are latent (unobserved). The diagram uses nodes (triangles and circles) to represent variables and directed edges (arrows) to represent causal influences.
### Components/Axes
* **Nodes:**
* Triangles: Represent observed variables. Labeled as X1, X2, Y2, Z1, and Z2.
* Circle: Represents a latent (unobserved) variable. Labeled as U.
* **Edges:** Directed arrows indicating causal relationships.
* Dark Blue Arrows: Represent causal influences between X1, X2, Y2, and U.
* Dark Green Arrows: Represent causal influences between Z1, Z2, and X1, X2.
### Detailed Analysis
* **Variable U:** The latent variable U is located at the bottom-center of the diagram. It has outgoing dark blue arrows pointing towards X1, X2, and Y2.
* **Variable X1:** Located on the left side of the diagram. It receives a dark blue arrow from U and a dark green arrow from Z1.
* **Variable X2:** Located on the right side of the diagram. It receives a dark blue arrow from U and a dark green arrow from Z2.
* **Variable Y2:** Located at the top-center of the diagram. It receives dark blue arrows from U and X2.
* **Variable Z1:** Located at the bottom-left of the diagram. It has a dark green arrow pointing towards X1.
* **Variable Z2:** Located at the bottom-right of the diagram. It has a dark green arrow pointing towards X2.
### Key Observations
* The latent variable U influences all observed variables X1, X2, and Y2.
* Variables Z1 and Z2 directly influence X1 and X2, respectively.
* Y2 is influenced by both U and X2.
### Interpretation
The diagram represents a causal model where the latent variable U has a direct influence on X1, X2, and Y2. The observed variables Z1 and Z2 act as instrumental variables, influencing X1 and X2, respectively. The variable Y2 is influenced by both the latent variable U and the observed variable X2. This type of diagram is often used in causal inference to represent relationships between variables and to identify potential causal effects. The presence of the latent variable U makes it more challenging to estimate the causal effects of X1, X2, Z1, and Z2 on Y2.