\n
## Charts: Pass@N over Gemma 2B Base & Scaling Laws
### Overview
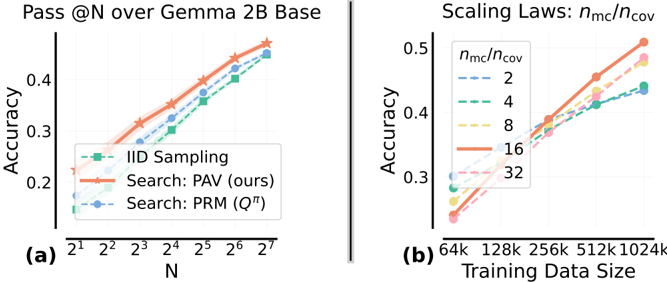
The image presents two charts comparing the performance of different sampling methods (IID, PAV, PRM) on the Gemma 2B Base model, measured by Pass@N accuracy. The first chart (a) shows accuracy versus the number of samples (N). The second chart (b) illustrates the impact of training data size on accuracy, with varying ratios of model capacity to coverage (ηmc/ηcov).
### Components/Axes
**Chart (a):**
* **Title:** Pass@N over Gemma 2B Base
* **X-axis:** N (labeled as 2<sup>1</sup>, 2<sup>2</sup>, 2<sup>3</sup>, 2<sup>4</sup>, 2<sup>5</sup>, 2<sup>6</sup>, 2<sup>7</sup>)
* **Y-axis:** Accuracy (ranging from approximately 0.15 to 0.5)
* **Legend:**
* IID Sampling (Green dashed line)
* Search: PAV (ours) (Orange solid line)
* Search: PRM (Q<sup>π</sup>) (Blue dashed line)
**Chart (b):**
* **Title:** Scaling Laws: ηmc/ηcov
* **X-axis:** Training Data Size (labeled as 64k, 128k, 256k, 512k, 1024k)
* **Y-axis:** Accuracy (ranging from approximately 0.3 to 0.5)
* **Legend:** (Color-coded lines representing different ηmc/ηcov ratios)
* 2 (Light Blue dashed line)
* 4 (Pale Green dashed line)
* 8 (Pink solid line)
* 16 (Orange solid line)
* 32 (Red solid line)
### Detailed Analysis or Content Details
**Chart (a):**
* **IID Sampling (Green):** Starts at approximately 0.17 accuracy at N=2<sup>1</sup> and increases steadily to approximately 0.47 accuracy at N=2<sup>7</sup>. The line is relatively straight, indicating a consistent increase in accuracy with increasing N.
* **Search: PAV (Orange):** Begins at approximately 0.18 accuracy at N=2<sup>1</sup> and rises more steeply than IID, reaching approximately 0.52 accuracy at N=2<sup>7</sup>.
* **Search: PRM (Blue):** Starts at approximately 0.19 accuracy at N=2<sup>1</sup> and increases at a rate between IID and PAV, reaching approximately 0.49 accuracy at N=2<sup>7</sup>.
**Chart (b):**
* **ηmc/ηcov = 2 (Light Blue):** Starts at approximately 0.32 accuracy at 64k and increases to approximately 0.42 accuracy at 1024k.
* **ηmc/ηcov = 4 (Pale Green):** Starts at approximately 0.34 accuracy at 64k and increases to approximately 0.45 accuracy at 1024k.
* **ηmc/ηcov = 8 (Pink):** Starts at approximately 0.36 accuracy at 64k and increases to approximately 0.47 accuracy at 1024k.
* **ηmc/ηcov = 16 (Orange):** Starts at approximately 0.38 accuracy at 64k and increases to approximately 0.49 accuracy at 1024k.
* **ηmc/ηcov = 32 (Red):** Starts at approximately 0.40 accuracy at 64k and increases to approximately 0.51 accuracy at 1024k.
### Key Observations
* In Chart (a), PAV consistently outperforms both IID and PRM across all values of N. PRM performs better than IID.
* In Chart (b), accuracy generally increases with training data size for all ηmc/ηcov ratios. Higher ηmc/ηcov ratios lead to higher accuracy, with the most significant gains observed at lower training data sizes.
* The performance gap between different ηmc/ηcov ratios appears to narrow as the training data size increases.
### Interpretation
The data suggests that the PAV search method is the most effective for improving Pass@N accuracy on the Gemma 2B Base model, particularly as the number of samples (N) increases. The scaling laws (Chart b) demonstrate the importance of balancing model capacity (ηmc) with coverage (ηcov) during training. Increasing the training data size consistently improves accuracy, but the optimal ratio between model capacity and coverage depends on the available data. The diminishing returns observed at larger training data sizes suggest that there may be a point of saturation where further increases in data yield only marginal improvements. The consistent outperformance of PAV indicates that its search strategy is more efficient at leveraging the available data to improve model performance. The charts provide empirical evidence for the benefits of both improved sampling techniques and careful consideration of scaling laws in language model training.