## Grouped Bar Chart: Relative Improvement (RI) by Answer Type
### Overview
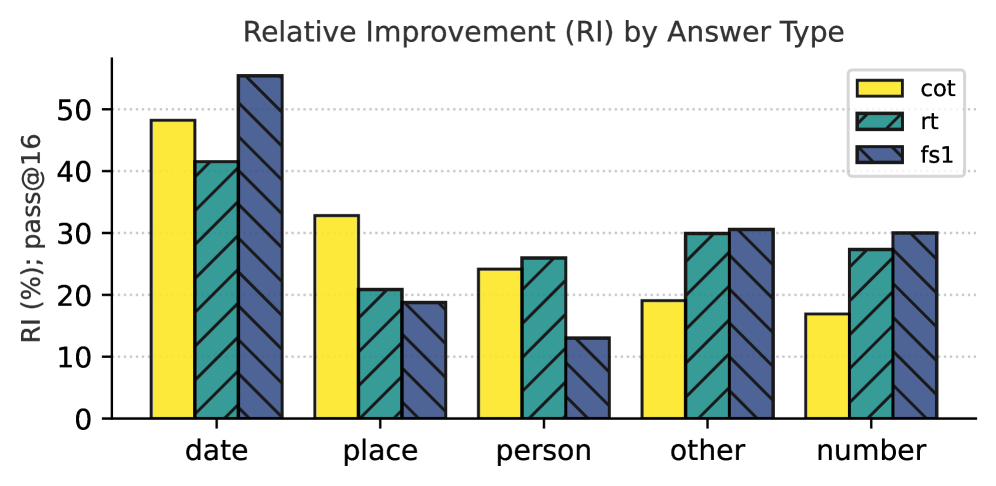
This is a grouped bar chart comparing the performance of three different methods or models (labeled "cot", "rt", and "fs1") across five distinct categories of answers. The performance metric is "Relative Improvement (RI)" measured as a percentage, with a secondary note of "pass@16". The chart visually demonstrates how each method's effectiveness varies depending on the type of answer being generated.
### Components/Axes
* **Chart Title:** "Relative Improvement (RI) by Answer Type" (centered at the top).
* **Y-Axis:**
* **Label:** "RI (%); pass@16" (rotated vertically on the left).
* **Scale:** Linear scale from 0 to 50, with major tick marks at intervals of 10 (0, 10, 20, 30, 40, 50).
* **X-Axis:**
* **Categories (from left to right):** "date", "place", "person", "other", "number".
* **Legend:**
* **Position:** Top-right corner of the chart area.
* **Items:**
1. **cot:** Represented by a solid yellow bar.
2. **rt:** Represented by a teal bar with diagonal hatching (stripes running from top-left to bottom-right).
3. **fs1:** Represented by a dark blue/indigo bar with diagonal hatching (stripes running from top-left to bottom-right).
### Detailed Analysis
The analysis is segmented by the five answer categories on the x-axis. For each category, the approximate RI (%) values for the three methods are estimated based on bar height relative to the y-axis grid lines.
**1. Category: `date`**
* **Visual Trend:** This category shows the highest overall RI values. The `fs1` bar is the tallest, followed by `cot`, then `rt`.
* **Data Points (Approximate):**
* `cot` (Yellow): ~48%
* `rt` (Teal, hatched): ~41%
* `fs1` (Dark blue, hatched): ~55% (This is the highest single value in the entire chart).
**2. Category: `place`**
* **Visual Trend:** A clear descending step pattern from `cot` to `rt` to `fs1`.
* **Data Points (Approximate):**
* `cot` (Yellow): ~33%
* `rt` (Teal, hatched): ~21%
* `fs1` (Dark blue, hatched): ~19%
**3. Category: `person`**
* **Visual Trend:** `rt` and `cot` are relatively close, with `rt` slightly higher. `fs1` shows a significant drop.
* **Data Points (Approximate):**
* `cot` (Yellow): ~24%
* `rt` (Teal, hatched): ~26%
* `fs1` (Dark blue, hatched): ~13% (This is the lowest value for `fs1` across all categories).
**4. Category: `other`**
* **Visual Trend:** `rt` and `fs1` are nearly equal and are the tallest bars. `cot` is notably shorter.
* **Data Points (Approximate):**
* `cot` (Yellow): ~19%
* `rt` (Teal, hatched): ~30%
* `fs1` (Dark blue, hatched): ~30.5%
**5. Category: `number`**
* **Visual Trend:** Similar to the "other" category, `rt` and `fs1` are close and lead, with `cot` trailing.
* **Data Points (Approximate):**
* `cot` (Yellow): ~17%
* `rt` (Teal, hatched): ~27%
* `fs1` (Dark blue, hatched): ~30%
### Key Observations
1. **Method Performance is Context-Dependent:** No single method (`cot`, `rt`, `fs1`) is universally superior. The best-performing method changes based on the answer type category.
2. **`fs1` Shows High Variance:** The `fs1` method achieves the highest overall RI (~55% for `date`) but also the lowest overall RI (~13% for `person`). Its performance is highly sensitive to the category.
3. **`cot` is Strong for `date` and `place`:** The `cot` method leads in the `place` category and is a strong second in `date`, but its performance drops significantly for `person`, `other`, and `number`.
4. **`rt` is Consistently Mid-to-High Tier:** The `rt` method rarely has the lowest score (only in `date` and `place`). It is the top performer in `person` and ties for the lead in `other` and `number`, showing more consistent, robust performance across diverse categories.
5. **Category Difficulty:** The `date` category appears to be the "easiest" for these models, yielding the highest RI scores overall. The `person` category seems particularly challenging for the `fs1` method.
### Interpretation
This chart provides a comparative analysis of three techniques (likely prompting or decoding strategies like Chain-of-Thought, Repeated Sampling, or Few-Shot with 1 example, given the labels) for improving a language model's performance on a task measured by "pass@16" (likely the probability of generating a correct answer in 16 attempts).
The data suggests that the effectiveness of a technique is not intrinsic but is deeply tied to the **nature of the information** being generated. Techniques that excel at factual recall for dates (`fs1`) may falter when reasoning about people. Conversely, a more balanced technique (`rt`) may provide reliable gains across a wider range of tasks without achieving the peak performance of a specialized one.
For a practitioner, this implies that model optimization should be **category-aware**. One might deploy a hybrid system that selects the best method (`cot`, `rt`, or `fs1`) based on the detected type of the query (e.g., a date question vs. a person question) to maximize overall system reliability and performance. The high variance of `fs1` indicates it is a high-risk, high-reward strategy, while `rt` represents a safer, more general-purpose improvement.