\n
## Line Charts: Comparative Performance of Reinforcement Learning Algorithms
### Overview
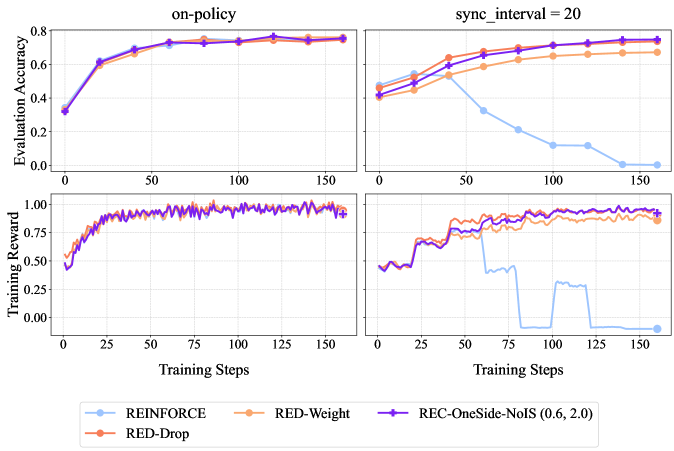
The image displays a 2x2 grid of line charts comparing the performance of four reinforcement learning algorithms across two different training conditions. The top row measures "Evaluation Accuracy," and the bottom row measures "Training Reward" over the course of "Training Steps." The left column represents an "on-policy" condition, while the right column represents a condition with "sync_interval = 20."
### Components/Axes
* **Titles:**
* Top-left chart: "on-policy"
* Top-right chart: "sync_interval = 20"
* **Y-Axis Labels:**
* Top row (both charts): "Evaluation Accuracy" (Scale: 0.0 to 0.8)
* Bottom row (both charts): "Training Reward" (Scale: 0.00 to 1.00)
* **X-Axis Label (All Charts):** "Training Steps" (Scale: 0 to 150, with major ticks at 0, 25, 50, 75, 100, 125, 150)
* **Legend (Bottom Center):**
* **REINFORCE:** Light blue line with circle markers.
* **RED-Weight:** Orange line with diamond markers.
* **RED-Drop:** Red line with square markers.
* **REC-OneSide-NoIS (0.6, 2.0):** Purple line with plus (+) markers.
### Detailed Analysis
**Top-Left Chart: Evaluation Accuracy (on-policy)**
* **Trend:** All four algorithms show a strong, similar upward trend, converging to high accuracy.
* **Data Points (Approximate):**
* All lines start near 0.35 at step 0.
* By step 25, all are clustered around 0.60-0.65.
* By step 75, all are tightly grouped between 0.70-0.75.
* From step 100 to 150, all lines plateau and remain very close, ending near 0.75-0.78.
**Top-Right Chart: Evaluation Accuracy (sync_interval = 20)**
* **Trend:** The REINFORCE algorithm shows a dramatic decline, while the other three maintain high performance.
* **Data Points (Approximate):**
* **REINFORCE (Light Blue):** Starts ~0.45, peaks ~0.55 at step 40, then declines sharply. It falls below 0.20 by step 100 and approaches 0.00 by step 150.
* **RED-Weight (Orange):** Starts ~0.45, rises steadily to ~0.70 by step 100, and plateaus near 0.72.
* **RED-Drop (Red) & REC-OneSide-NoIS (Purple):** Both start ~0.40, follow a very similar upward path, and converge near 0.75-0.78 by step 150, slightly outperforming RED-Weight.
**Bottom-Left Chart: Training Reward (on-policy)**
* **Trend:** All algorithms show rapid initial learning and converge to a high, stable reward.
* **Data Points (Approximate):**
* All lines start near 0.50.
* They rise sharply, reaching ~0.90 by step 50.
* From step 50 to 150, all lines fluctuate in a tight band between approximately 0.90 and 1.00, showing stable convergence.
**Bottom-Right Chart: Training Reward (sync_interval = 20)**
* **Trend:** REINFORCE collapses to near-zero reward, while the other algorithms maintain high reward.
* **Data Points (Approximate):**
* **REINFORCE (Light Blue):** Starts ~0.50, rises to ~0.75 by step 50, then crashes. It drops to near 0.00 by step 80, shows a brief, small recovery around step 100, then falls back to 0.00.
* **RED-Weight (Orange):** Starts ~0.50, rises to ~0.90 by step 75, and remains stable between 0.85-0.95.
* **RED-Drop (Red) & REC-OneSide-NoIS (Purple):** Both follow a nearly identical path, starting ~0.50, rising to ~0.95 by step 75, and maintaining a high reward between 0.90-1.00.
### Key Observations
1. **Algorithm Divergence:** The "sync_interval = 20" condition causes a catastrophic performance collapse for the REINFORCE algorithm in both evaluation accuracy and training reward, while the other three methods (RED-Weight, RED-Drop, REC-OneSide-NoIS) remain robust.
2. **Method Similarity:** RED-Drop and REC-OneSide-NoIS (0.6, 2.0) perform almost identically across all four charts, suggesting similar underlying behavior or effectiveness in these scenarios.
3. **Stability vs. Instability:** The "on-policy" condition leads to stable, convergent learning for all methods. The "sync_interval = 20" condition introduces instability that only REINFORCE succumbs to.
4. **Performance Ceiling:** Under stable conditions (on-policy), all methods appear to reach a similar performance ceiling (~0.75 accuracy, ~0.95 reward).
### Interpretation
This data demonstrates a critical vulnerability in the standard REINFORCE algorithm when training is synchronized at intervals (sync_interval=20), likely due to issues with stale gradients or policy lag. The other three algorithms, which presumably incorporate mechanisms to handle off-policy or delayed updates (implied by names like "RED" and "REC"), show significant robustness to this synchronization delay.
The near-identical performance of RED-Drop and REC-OneSide-NoIS suggests that their specific technical differences may not be consequential for this particular task and set of conditions. The charts effectively argue that for distributed or synchronized training setups, using one of the more robust variants (RED or REC family) is essential to prevent complete training failure, as exhibited by REINFORCE. The "on-policy" results serve as a control, proving all algorithms are capable of learning the task under ideal, low-latency conditions.