## Line Chart: Throughput vs. Batch Size (b) for varying Matrix Dimensions (m)
### Overview
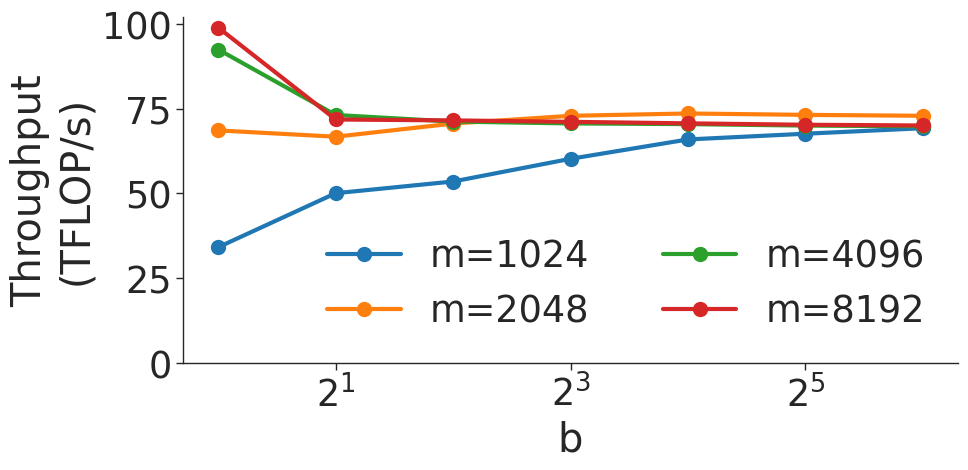
This image displays a line chart illustrating the relationship between throughput (measured in TFLOP/s) and a variable 'b' (likely batch size) across four different matrix dimensions 'm' (1024, 2048, 4096, 8192). The chart demonstrates how throughput performance scales as the batch size increases for different problem sizes.
### Components/Axes
* **Y-Axis**: Labeled "Throughput (TFLOP/s)". The scale ranges from 0 to 100, with major tick marks at 0, 25, 50, 75, and 100.
* **X-Axis**: Labeled "b". The scale is logarithmic. While only $2^1$, $2^3$, and $2^5$ are explicitly labeled, the chart contains 6 data points per series, corresponding to $2^0$ (1), $2^1$ (2), $2^2$ (4), $2^3$ (8), $2^4$ (16), and $2^5$ (32).
* **Legend**: Located in the bottom-right quadrant of the chart area.
* **Blue line**: $m=1024$
* **Orange line**: $m=2048$
* **Green line**: $m=4096$
* **Red line**: $m=8192$
### Detailed Analysis
The chart plots four distinct series. Below are the approximate values for each data point (x-axis values inferred as $2^0$ to $2^5$):
| x-axis ($b$) | Blue ($m=1024$) | Orange ($m=2048$) | Green ($m=4096$) | Red ($m=8192$) |
| :--- | :--- | :--- | :--- | :--- |
| **1 ($2^0$)** | ~35 | ~69 | ~93 | ~100 |
| **2 ($2^1$)** | ~50 | ~67 | ~73 | ~72 |
| **4 ($2^2$)** | ~53 | ~71 | ~71 | ~72 |
| **8 ($2^3$)** | ~60 | ~73 | ~71 | ~71 |
| **16 ($2^4$)** | ~66 | ~74 | ~71 | ~70 |
| **32 ($2^5$)** | ~69 | ~73 | ~70 | ~70 |
**Trend Verification:**
* **Blue ($m=1024$)**: Slopes upward consistently. It starts at the lowest throughput and shows the most significant growth as 'b' increases, though the rate of growth slows down.
* **Orange ($m=2048$)**: Starts at ~69, dips slightly at $b=2$, then rises to a plateau around 73-74.
* **Green ($m=4096$)**: Starts high (~93), drops sharply at $b=2$ to ~73, then remains relatively flat, slightly declining toward 70.
* **Red ($m=8192$)**: Starts at the highest point (~100), drops sharply at $b=2$ to ~72, then remains relatively flat, slightly declining toward 70.
### Key Observations
* **Convergence**: All four series converge toward a throughput range of 69–73 TFLOP/s as 'b' increases to 32.
* **Inversion of Performance**: At low batch sizes ($b=1$), larger matrix dimensions ($m=8192$) provide significantly higher throughput. However, as the batch size increases, this advantage disappears, and the performance of all 'm' values becomes nearly identical.
* **Blue Line Anomaly**: The $m=1024$ series is the only one that benefits significantly from increasing the batch size 'b'. The other three series ($m=2048, 4096, 8192$) reach their peak performance almost immediately or experience a performance penalty when moving from $b=1$ to $b=2$.
### Interpretation
This data is characteristic of a GPU performance benchmark, likely for matrix multiplication kernels.
* **Small 'm' (1024)**: At small batch sizes, the workload is likely too small to saturate the GPU's compute units, leading to low throughput. Increasing the batch size allows for better parallelization and occupancy, hence the steady upward trend.
* **Large 'm' (4096, 8192)**: These configurations are large enough to saturate the GPU compute units even at $b=1$, achieving very high throughput (near peak). The sharp drop at $b=2$ suggests that increasing the batch size introduces overhead (e.g., memory management, kernel launch overhead, or cache thrashing) that outweighs the benefits of increased parallelism.
* **Saturation Point**: The convergence at $b=32$ suggests that the hardware has reached a theoretical throughput limit (a "ceiling") where the specific matrix size 'm' no longer dictates performance, and the system is likely compute-bound.